
Figures & data
Table 1 Patient characteristics
Figure 1 Immunohistochemical staining data.
Notes: (A) 9.4% of nuclei highly expressed XBP1s; (B) 4.4% of cytoplasm highly expressed XBP1s. Magnification: 20×.
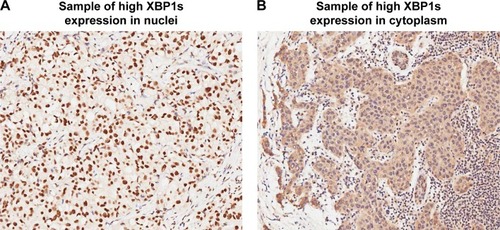
Figure 2 Kaplan–Meier survival analysis categorized by clinical stage.
Notes: (A) Survival rates of stage 1, stage 2, and stage 3 were 88.9%, 79.4%, and 59.2%, respectively, and differences were statistically significant (log-rank P=0.005); (B) survival curves of clinical stage 1–3 (using the 6th American Joint Committee on Cancer TNM staging system as the criterion).
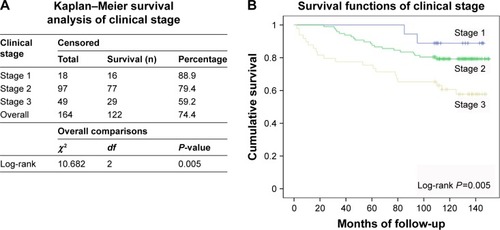
Figure 3 Survival curves of (A) nuclear XBP1s (XBP1s-N) expression and (B) cytoplasmic XBP1s (XBP1s-C) expression.
Notes: (A) In the XBP1s-N group, the survival rate of patients with low XBP1s expression was 75% and that of patients with high XBP1s expression 46.7% (P=0.018). (B) In the XBP1s-C group, 71.7% of patients with low XBP1s expression survived and 85.7% with high XBP1s expression survived; however, this difference was not significant (P=0.471). Reproduced from Ming J, Ruan S, Wang M, et al. A novel chemical, STF-083010, reverses tamoxifen-related drug resistance in breast cancer by inhibiting IRE1/XBP1. Oncotarget. 2015;6(38):40692–40703.Citation20
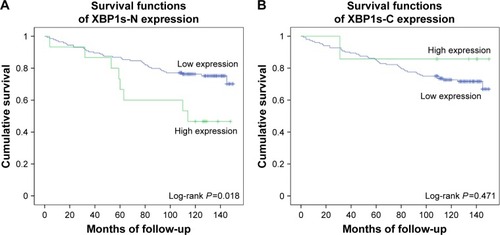
Table 2 Kaplan–Meier survival analysis and log-rank test
Table 3 Correlation of nuclear XBP1s expression with various clinicopathological parameters
Table 4 Multivariate Cox regression analysis