Figures & data
Figure 1 Relative circRNA0003906 expression in CRC cell lines.
Notes: circRNA0003906 expression levels in six CRC cell lines (HCT8, HCT116, SW480, SW620, HT29, and LoVo) and normal colon epithelial cell line NCM460 was determined by qRT-PCR. The values are given as mean ± SD of three independent experiments. *P<0.05.
Abbreviations: CRC, colorectal cancer; qRT-PCR, quantitative real-time polymerase chain reaction; SD, standard deviation.
Abbreviations: CRC, colorectal cancer; qRT-PCR, quantitative real-time polymerase chain reaction; SD, standard deviation.
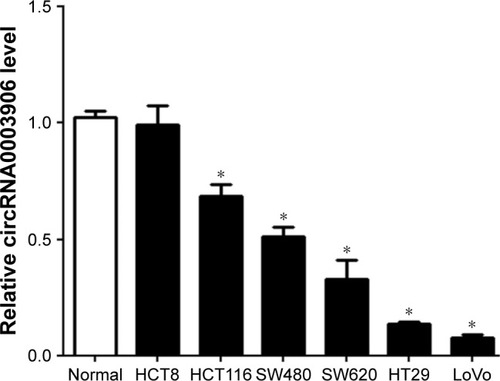
Figure 2 Relative circRNA0003906 expression in CRC tissues.
Notes: (A) Of 122 CRC patients, 92 (75.4%) exhibited significant downregulation of circRNA0003906 in cancerous tissues compared with adjacent nontumor tissues. (B) circRNA0003906 expression level in 122 CRC tissues compared with adjacent nontumor tissues. The values are mean ± SD of three independent experiments. **P<0.0001.
Abbreviations: CRC, colorectal cancer; SD, standard deviation.
Abbreviations: CRC, colorectal cancer; SD, standard deviation.
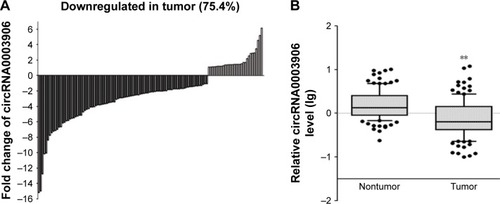
Table 1 Clinicopathological correlation of circRNA0003906 expression in CRC
Figure 3 The ROC curve for differentiating CRC tissues from healthy controls.
Notes: The ROC curve was constructed using IBM SPSS Statistics for Windows, Version 22.0 (IBM Corp., Armonk, NY, USA). The area under the ROC curve was 0.818 (95% confidence interval =0.749–0.888; P<0.001). The specificity and sensitivity were 0.725 and 0.803, respectively.
Abbreviations: CRC, colorectal cancer; ROC, receiver operating characteristics.
Abbreviations: CRC, colorectal cancer; ROC, receiver operating characteristics.
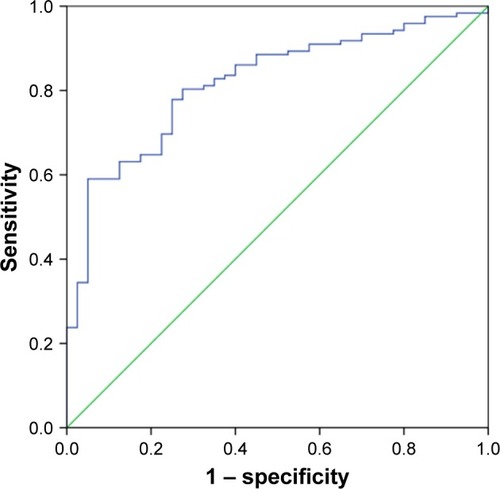
Figure S1 The melt curve of circRNA0003906.