
Figures & data
Figure 1 Representative expression of Sam68 and Ki-67 and their correlation in sacral chordomas.
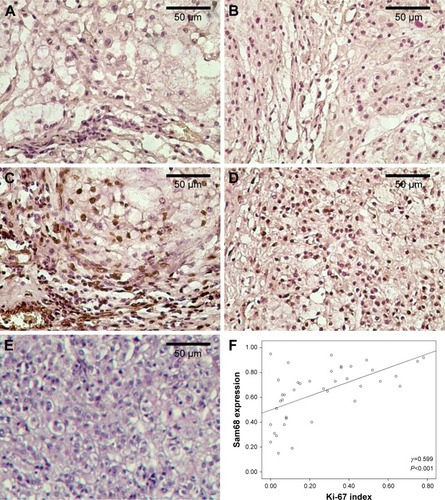
Table 1 Expression of Sam68 in sacral chordomas compared with distant normal tissues
Table 2 Association between Sam68 expression and the clinicopathologic characteristics of patients with sacral chordoma
Figure 2 Kaplan–Meier curves of the local recurrence-free survival of patients with sacral chordoma.
Abbreviations: EA, Enneking appropriate; EI, Enneking inappropriate.
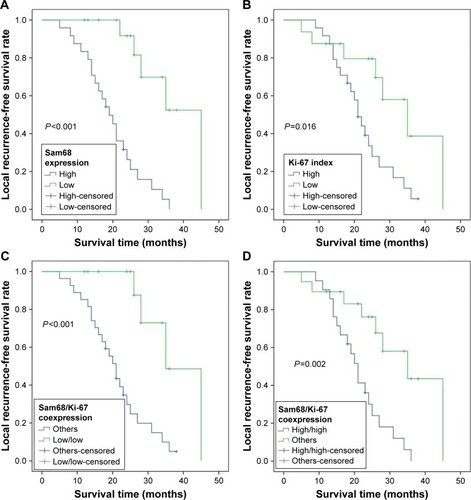
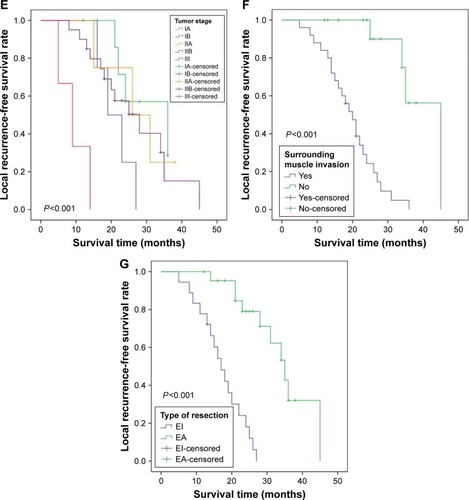
Figure 3 Kaplan–Meier curves of the overall survival of patients with sacral chordoma.
Abbreviations: EA, Enneking appropriate; EI, Enneking inappropriate.
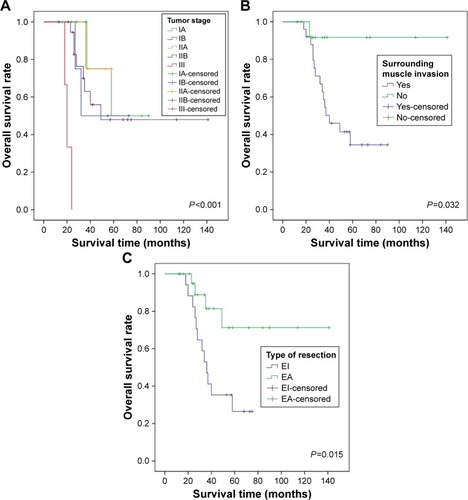
Table 3 Kaplan–Meier analysis and multivariate Cox’s proportional hazard analysis of the prognostic factors for the local recurrence-free survival of patients with sacral chordoma
Table 4 Kaplan–Meier analysis and multivariate Cox’s proportional hazard analysis of the prognostic factors for the overall survival of patients with sacral chordoma