Figures & data
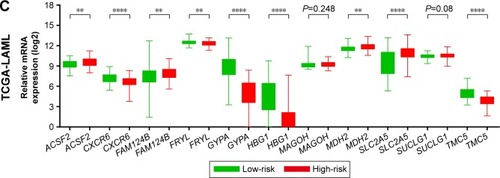
Figure 1 Venn diagram of prognostic gene markers for the three gene expression microarray data cohorts (TCGA-LAML, GSE12417 HG-U133A, and HG-U133 plus 2.0 cohorts).
Abbreviations: HR, hazard ratio; TCGA-LAML, The Cancer Genome Atlas AML project.
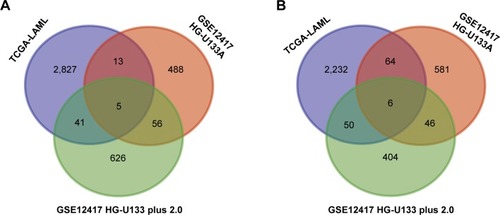
Figure 2 The prognostic value of the 11 genes for AML patients in the GSE12417 HG-U133A cohort.
Abbreviations: ACSF2, acyl-CoA synthetase family member 2; AML, acute myeloid leukemia; CXCR6, C-X-C motif chemokine receptor 6; FAM124B, family with sequence similarity 124 member B; FRYL, FRY-like transcription coactivator; GYPA, glycophorin A; HBG1, hemoglobin subunit gamma 1; MAGOH, mago homolog, exon junction complex core component; MDH2, malate dehydrogenase 2; OS, overall survival; SLC2A5, solute carrier family 2 member 5; SUCLG1, succinate-CoA ligase alpha subunit; TMC5, transmembrane channel like 5.
Figure 3 The prognostic value of the 11 genes for AML patients in the GSE12417 HG-U133 plus 2.0 cohort.
Abbreviations: ACSF2, acyl-CoA synthetase family member 2; AML, acute myeloid leukemia; CXCR6, C-X-C motif chemokine receptor 6; FAM124B, family with sequence similarity 124 member B; FRYL, FRY-like transcription coactivator; GYPA, glycophorin A; HBG1, hemoglobin subunit gamma 1; MAGOH, mago homolog, exon junction complex core component; MDH2, malate dehydrogenase 2; OS, overall survival; SLC2A5, solute carrier family 2 member 5; SUCLG1, succinate-CoA ligase alpha subunit; TMC5, transmembrane channel like 5.
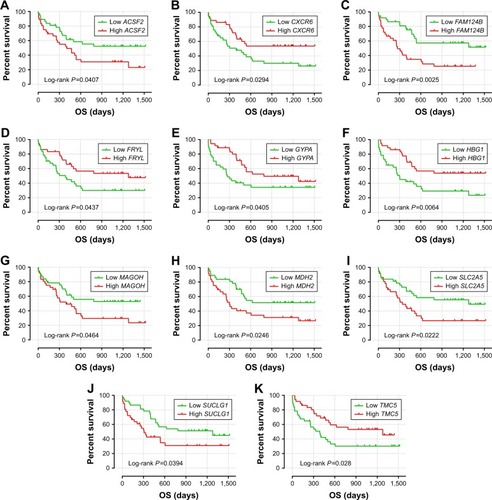
Figure 4 The prognostic value of the 11 genes for AML patients in the TCGA-LAML cohort.
Abbreviations: ACSF2, acyl-CoA synthetase family member 2; AML, acute myeloid leukemia; CXCR6, C-X-C motif chemokine receptor 6; FAM124B, family with sequence similarity 124 member B; FRYL, FRY-like transcription coactivator; GYPA, glycophorin A; HBG1, hemoglobin subunit gamma 1; MAGOH, mago homolog, exon junction complex core component; MDH2, malate dehydrogenase 2; OS, overall survival; SLC2A5, solute carrier family 2 member 5; SUCLG1, succinate-CoA ligase alpha subunit; TMC5, transmembrane channel like 5; TCGA-LAML, The Cancer Genome Atlas AML project.
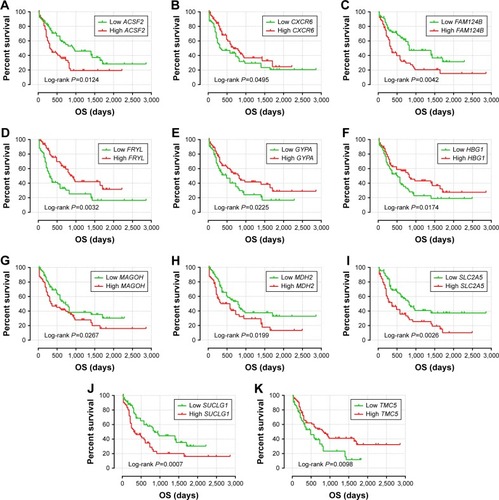
Figure 5 Prognostic gene signature of the 11 genes in AML patients of the GSE12417 HG-U133A cohort.
Abbreviations: AML, acute myeloid leukemia; AUC, area under the ROC curve; CI, confidence interval; OS, overall survival; ROC, receiver operating characteristic.
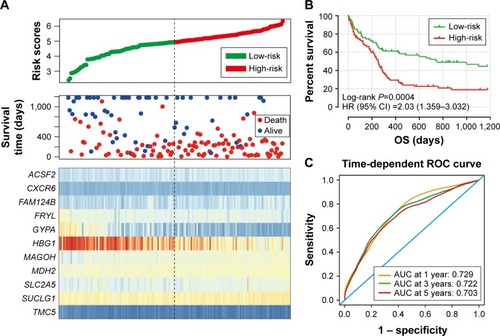
Table 1 Prognostic value of the 11 genes in AML patients of the three cohorts
Figure 6 Prognostic gene signature of the 11 genes in AML patients of GSE12417 HG-U133 plus 2.0 cohort.
Abbreviations: AUC, area under the ROC curve; AML, acute myeloid leukemia; CI, confidence interval; OS, overall survival; ROC, receiver operating characteristic.
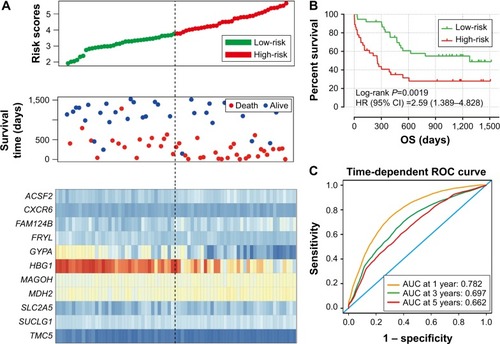
Figure 7 Prognostic gene signature of the 11 genes in AML patients of the TCGA-LAML cohort.
Abbreviations: AML, acute myeloid leukemia; AUC, area under the ROC curve; CI, confidence interval; OS, overall survival; ROC, receiver operating characteristic; TCGA-LAML, The Cancer Genome Atlas AML project.
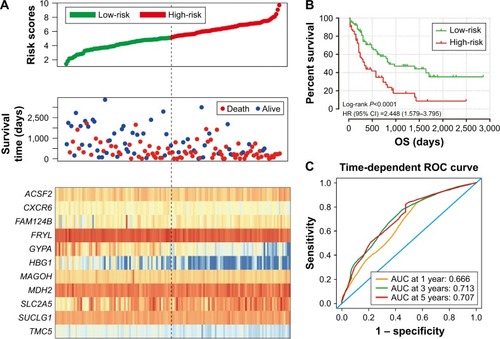
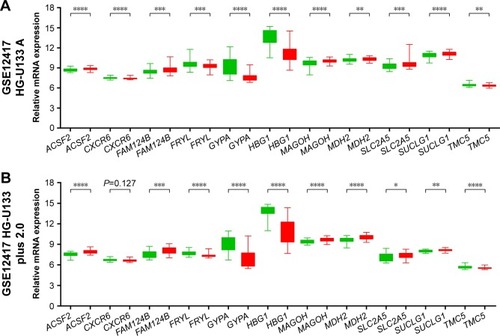
Figure 8 The expression level distribution of the 11 genes in the low- and high-risk groups.
Abbreviation: TCGA-LAML, The Cancer Genome Atlas AML project.