Figures & data
Table 1 Association of miR-329 with the clinicopathological features of breast cancer patients
Figure 1 Expression of miR-329 in serum and tissue specimens.
Notes: (A) miR-329 expression was downregulated in the serum samples of breast cancer patients compared with those of healthy controls (*P=0.0056). (B) The expression of miR-329 was decreased in breast cancer tissues compared with adjacent normal tissues (*P=0.0068). (C) The serum expression of miR-329 was positively correlated with the miR-329 tissue expression (R=0.493, P<0.001).
Abbreviation: miR-329, microRNA-329.
Abbreviation: miR-329, microRNA-329.
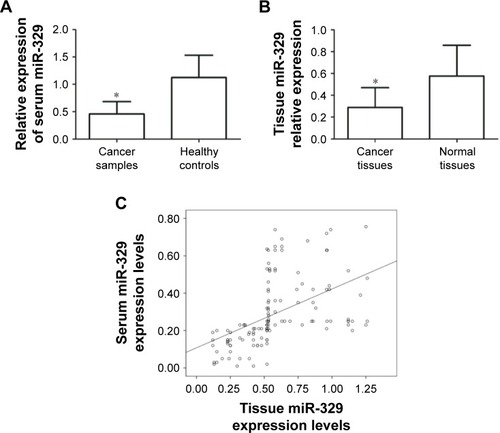
Figure 2 Expression of miR-329 in breast cancer cell-derived exosomes.
Note: No difference in miR-329 expression was found between breast cancer cells and normal breast cells (P>0.05).
Abbreviation: miR-329, microRNA-329.
Abbreviation: miR-329, microRNA-329.
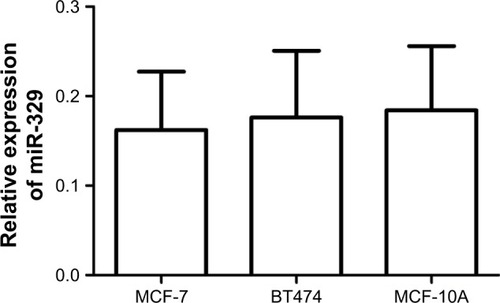
Figure 3 ROC curve based on the expression of miR-329 for breast cancer patients.
Note: The AUC value was 0.932, indicating the high diagnostic value of miR-329 for patients with breast cancer.
Abbreviations: AUC, area under the curve; miR-329, microRNA-329; ROC, receiver operating characteristic.
Abbreviations: AUC, area under the curve; miR-329, microRNA-329; ROC, receiver operating characteristic.
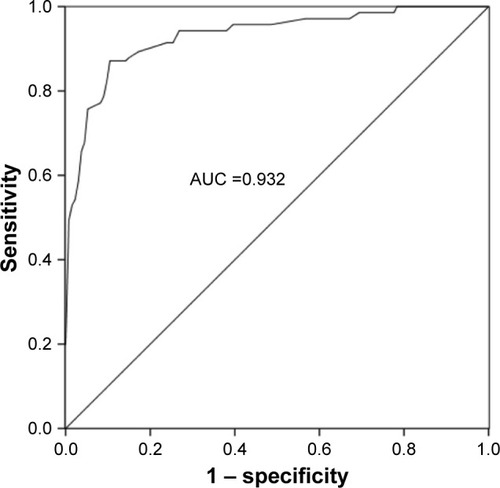
Figure 4 Kaplan–Meier survival analysis for breast cancer patients based on the difference in expression of miR-329.
Note: Decreased miR-329 expression correlated with poor overall survival of cancer patients (log-rank P<0.001).
Abbreviation: miR-329, microRNA-329.
Abbreviation: miR-329, microRNA-329.
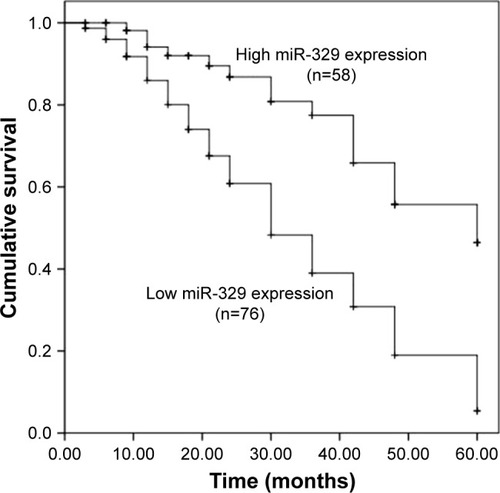
Table 2 Cox regression analysis for miR-329 in patients with breast cancer
Figure 5 Expression of miR-329 in breast cancer patients as per data collected from TCGA.
Note: Downregulated miR-329 expression was detected in breast cancer cases compared with the normal controls (***P=0.00065).
Abbreviations: miR-329, microRNA-329; TCGA, The Cancer Genome Atlas.
Abbreviations: miR-329, microRNA-329; TCGA, The Cancer Genome Atlas.
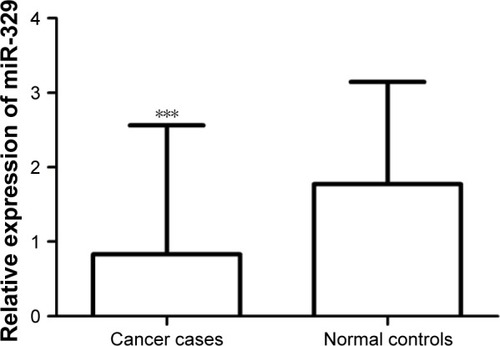
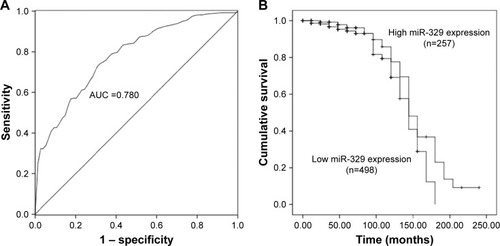
Figure 6 Clinical significance of miR-329 in breast cancer patients as per data collected from TCGA.
Notes: (A) miR-329 had a relatively high diagnostic performance with an AUC of 0.780. (B) Downregulated miR-329 expression proved to be associated with poor overall survival of breast cancer patients (log-rank P=0.033).
Abbreviations: AUC, area under the curve; miR-329, microRNA-329; TCGA, The Cancer Genome Atlas.
Abbreviations: AUC, area under the curve; miR-329, microRNA-329; TCGA, The Cancer Genome Atlas.