Figures & data
Figure 1 Growth and cytotoxic effects of crizotinib on breast cancer cells.
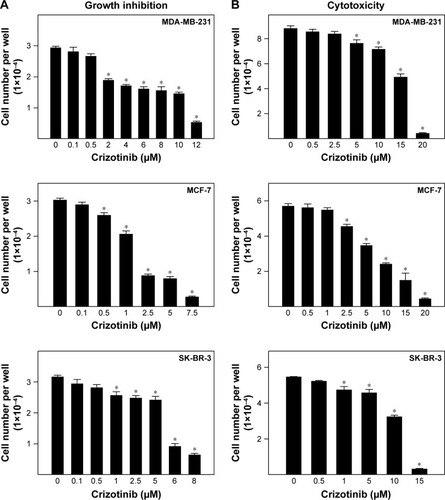
Figure 2 Effects of chemotherapeutic agents on growth of breast cancer cells.
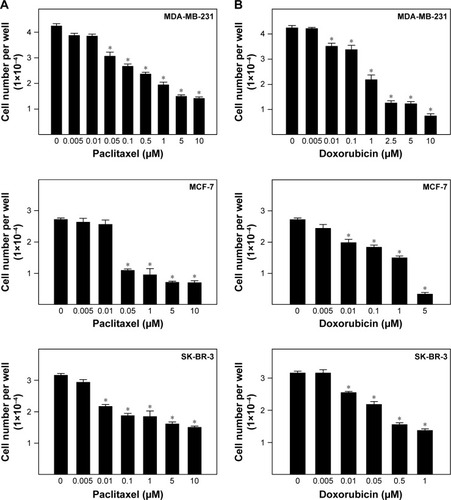
Figure 3 Effects of combined treatment of crizotinib and chemotherapeutic agents on growth of breast cancer cells.
Abbreviation: ND, not detectable.
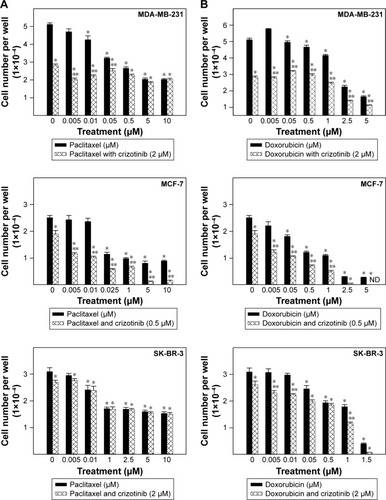
Figure 4 Isobolograms for the anti-proliferative effects of combined treatment of crizotinib and chemotherapeutic drugs in breast cancer cells.
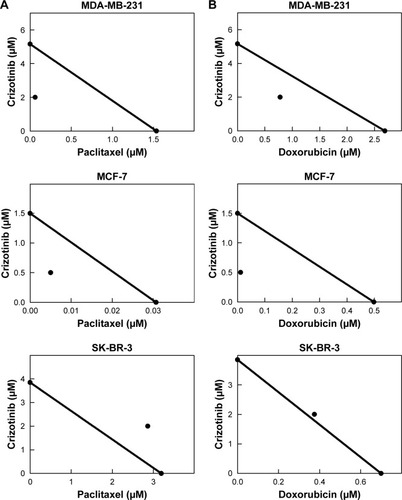
Table 1 CI and DRI values for combined treatment of crizotinib and chemotherapeutic drugs resulting in 50% reduction in growth of multiple breast cancer cell lines
Figure 5 Effect of crizotinib treatment on Ki-67 labeling in breast cancer cells.
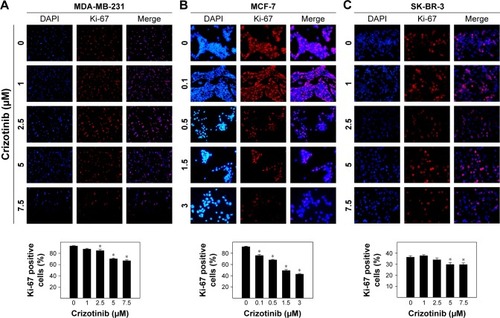
Figure 6 Effect of crizotinib treatment on migration and invasion of breast cancer cells.
Abbreviation: BME, basement membrane extract.
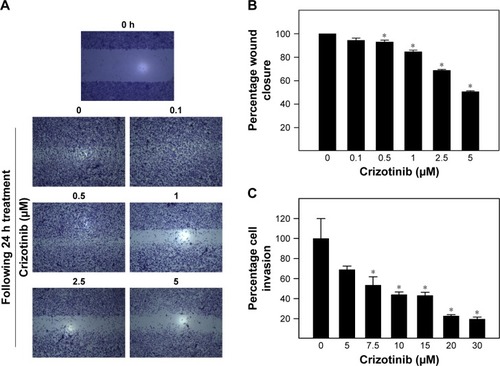
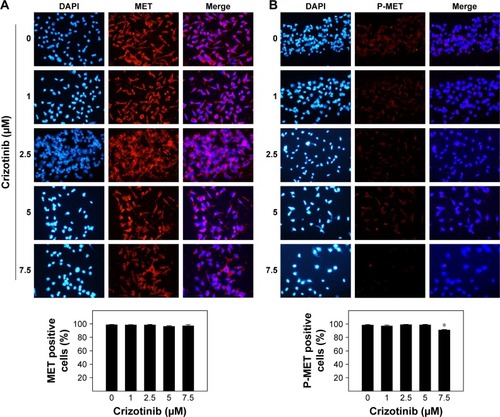
Figure 7 Effect of crizotinib treatment on total levels of MET and phospho-MET (P-MET) in breast cancer cells.