
Figures & data
Figure 1 The protein and mRNA levels of MPC1 were significantly decreased in GC tissues and cell lines.
Abbreviations: GC, gastric cancer; IHC, immunohistochemistry.
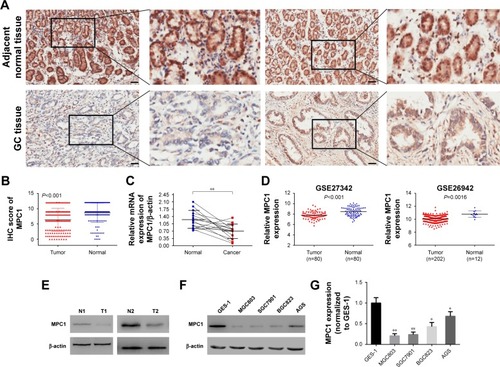
Table 1 MPC1 expression in GC and adjacent normal mucosa
Figure 2 MPC1 expression was closely correlated with TNM stage in patients with GC.
Abbreviations: TNM, tumor node metastasis; GC, gastric cancer; IHC, immunohistochemistry.
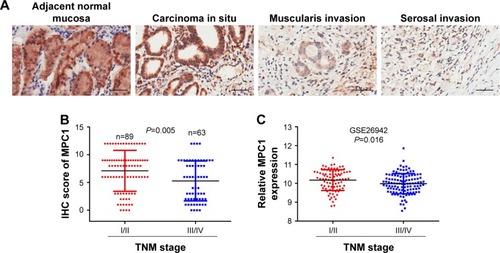
Table 2 The relationship between MPC1 expression and clinicopathological features of GC patients
Figure 3 Kaplan–Meier analysis of overall survival according to the expression of MPC1 in patients with GC.
Abbreviation: GC, gastric cancer.
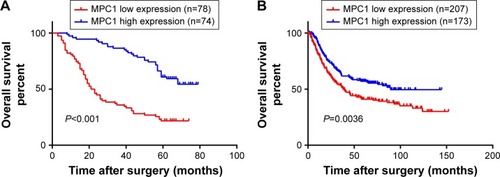
Table 3 Univariate and multivariate analyses of overall survival in GC patients
Figure 4 Overexpression of MPC1 attenuated the proliferative, migrating, and invasive abilities of human GC cells.
Abbreviation: GC, gastric cancer.
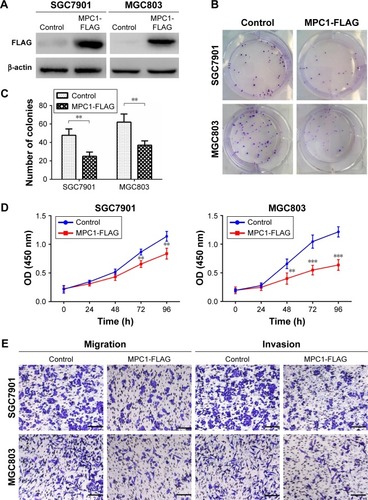
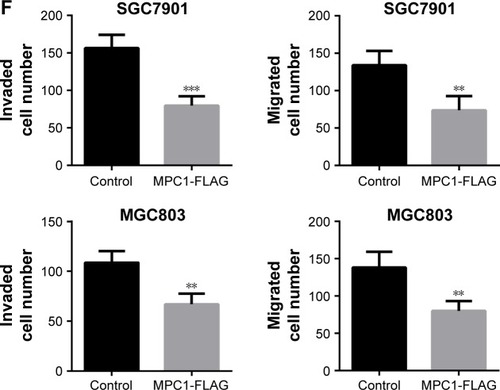
Figure 5 Overexpression of MPC1 attenuated the stem cell-like properties of human GC cells.
Abbreviation: GC, gastric cancer.
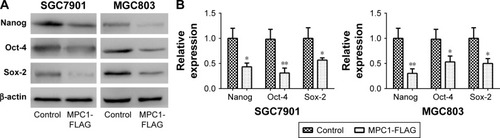
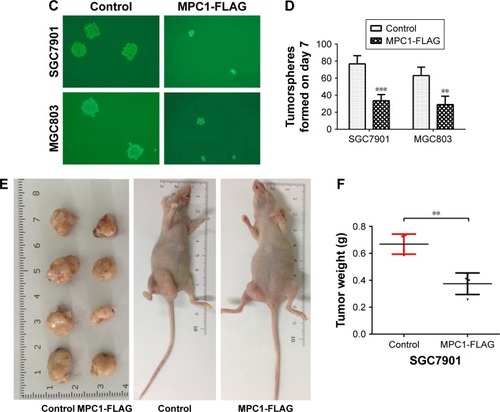
Figure S1 (A) H&E staining of GC samples. (B) The intensity of MPC1 in GC cells. Scale bar, 50 μm; magnification ×200. (C) The relative risk plot of each IHC score generated by X-tile software to identify the optimal cutoff value.
Abbreviations: GC, gastric cancer; IHC, immunohistochemistry; Pt, patient.
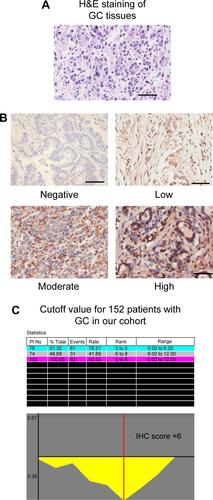
Table S1 Clinical features of patients with GC
Table S2 Sequences of primers used for qRT-PCR in this study