Figures & data
Figure 1 Representative images of CXCL5 expression by immunohistochemical staining.
Notes: (A) Normal, (B) adenocarcinoma, (C) squamous carcinoma, (D) papillary cancer, (E) SCLC, (F) carcinoid, (G) bronchioloalveolar cancer, (H) giant cell carcinoma, (I) metastatic tumor, (J) quantitative score of CXCL5. Magnification 200×.
Abbreviation: SCLC, small cell lung cancer.
Abbreviation: SCLC, small cell lung cancer.
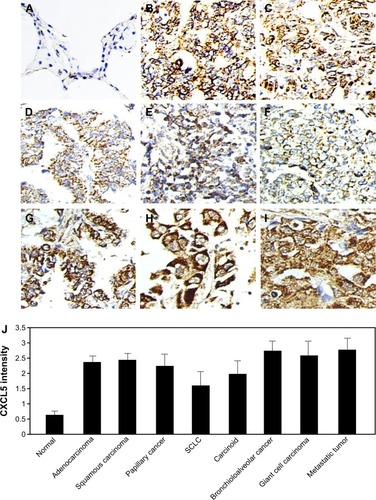
Figure 2 Association of CXCL5 expression with pathological parameters in adenocarcinoma by immunohistochemical staining.
Notes: (A) Grade 1 vs 3, (B) T stage 1 vs 3, (C) TNM stage I vs III, (D) lymph node positive vs negative. Left panel: representative images, right panel: quantitative score.
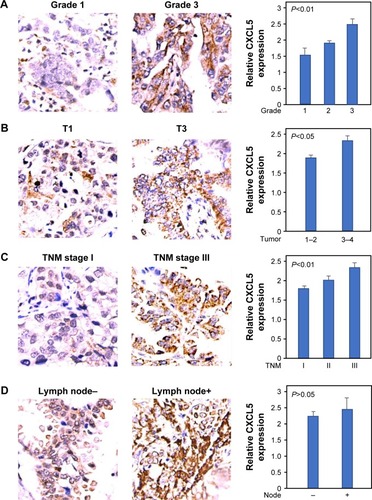
Figure 3 Prognostic value of CXCL5 in adenocarcinoma.
Notes: (A) Kaplan–Meier curve of patients with low or high CXCL5 expression. Median level was used to divide patients into subgroups. (B) Multivariate analysis of clinical and pathological parameters.
Abbreviations: Sig, significance; Exp, odd ratio value; B, beta; SE, standard error.
Abbreviations: Sig, significance; Exp, odd ratio value; B, beta; SE, standard error.
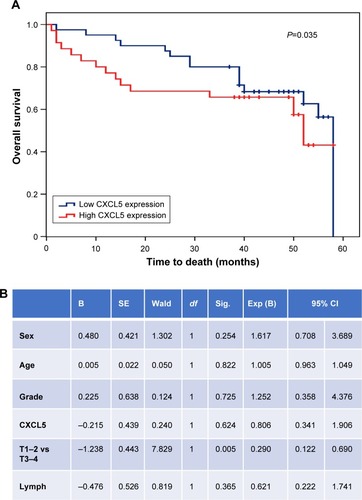
Figure 4 Serum CXCL5 concentration detected by ELISA.
Notes: (A) Standard curve of CXCL5 with OD value. (B) Peripheral serum CXCL5 in healthy volunteers and lung adenocarcinoma patients.
Abbreviations: OD, optical density; N, normal.
Abbreviations: OD, optical density; N, normal.
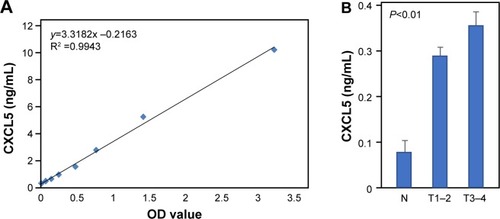
Figure 5 Forest plot of HR and OS of CXCL5.
Notes: (A) Relative risk of CXCL5 mRNA expression to OS in NSCLC. OR value of CXCL5 in ADC vs SQC (B) stages III–IV vs I–II in NSCLC (C) and ADC (D), OR value of CXCL5 comparing N+ and N− patients in NSCLC (E) and ADC (F).
Abbreviations: HR, hazard ratio; OR, odds ratio; OS, overall survival; NSCLC, non-small cell lung cancer; ADC, adenocarcinoma; SQC, squamous cell lung cancer ; N+, lymph node positive; N−, lymph node negative.
Abbreviations: HR, hazard ratio; OR, odds ratio; OS, overall survival; NSCLC, non-small cell lung cancer; ADC, adenocarcinoma; SQC, squamous cell lung cancer ; N+, lymph node positive; N−, lymph node negative.
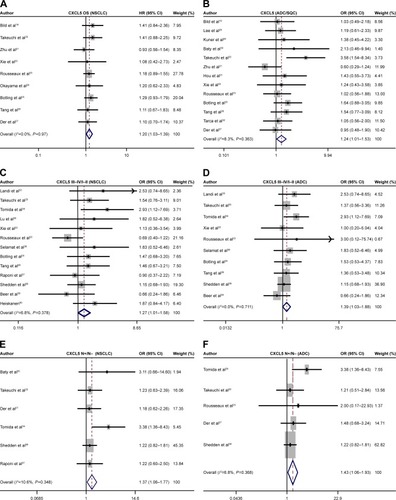
Figure 6 Kaplan–Meier survival curve.
Notes: Association between CXCL5 and OS (A), PPS (B), and PFS (C) in NSCLC patients. (D) Association of CXCL5 with PFS in patients with ADC.
Abbreviations: HR, hazard ratio; OS, overall survival; PPS, post-progression survival; PFS, progression-free survival; ADC, adenocarcinoma; NSCLC, non-small cell lung cancer.
Abbreviations: HR, hazard ratio; OS, overall survival; PPS, post-progression survival; PFS, progression-free survival; ADC, adenocarcinoma; NSCLC, non-small cell lung cancer.
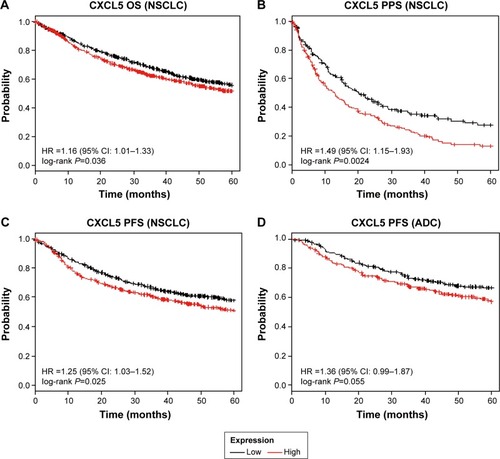
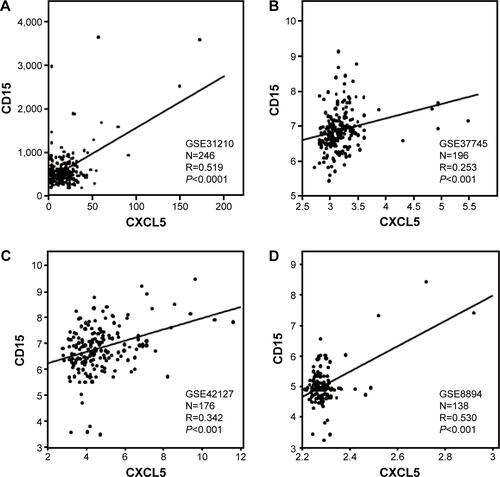
Figure S1 Regression analysis between CXCL5 with neutrophil surface marker CD15 in GSE31210 (A), GSE37745 (B), GSE42127 (C), and GSE8894 (D).