
Figures & data
Figure 1 The mRNA expression and protein levels were detected by qRT-PCR (A), agarose gel electrophoresis (B), and Western blot (C, D) after transfection of MDA-MB-231 breast cancer cells with three different pairs of siRNA. si-1, si-2, and si-3 represent different sequences of siSIRT7. **p<0.01 and ***p<0.001.
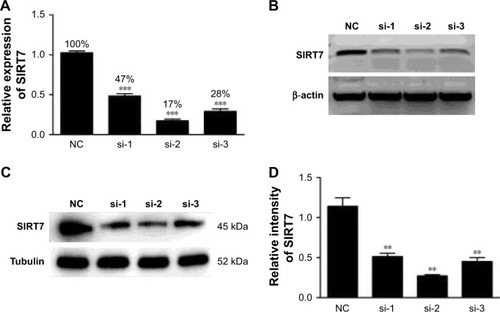
Figure 2 Differentially expressed mRNAs (A) and lncRNAs (B) were analyzed by hierarchical clustering within NC and siSIRT7 groups in MDA-MB-231 cells; red indicates high relative expression, and green indicates low relative expression. (C, D) The number of mRNAs and lncRNAs differentially expressed.
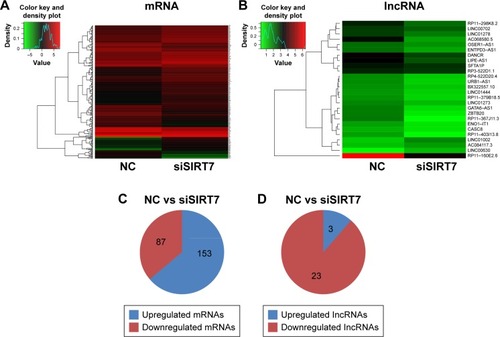
Table 1 Top 20 differentially expressed of mRNAs
Table 2 Differentially expressed lncRNAs
Figure 3 qRT-PCR was performed to confirm the validity of the RNA-Seq data in MDA-MB-231 and MCF-7 cells. The mRNAs (A, C) and lncRNAs (B, D) were expressed as log2 values (RNA-Seq) and −ΔΔCt values (qRT-PCR).
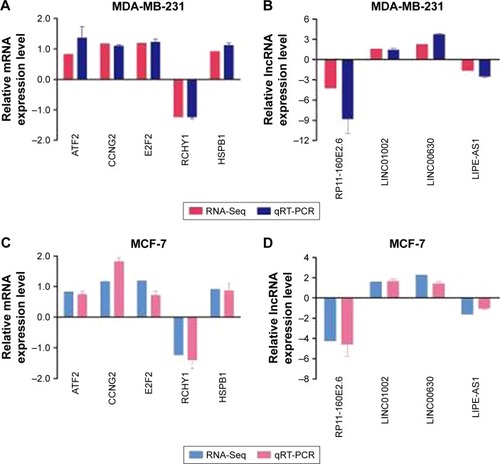
Figure 4 GO analysis of the differentially expressed genes after depletion of SIRT7. (A) GO analysis results showed that these mRNAs were enriched in the biological functions related to cellular processes, biological regulation, metabolic process, and signal-organism process. (B) The cellular component of these genes included cell, cell part, membrane, and organelle. (C) The molecular function of these genes composed of binding, catalytic activity, transporter activity, and molecular transducer activity.
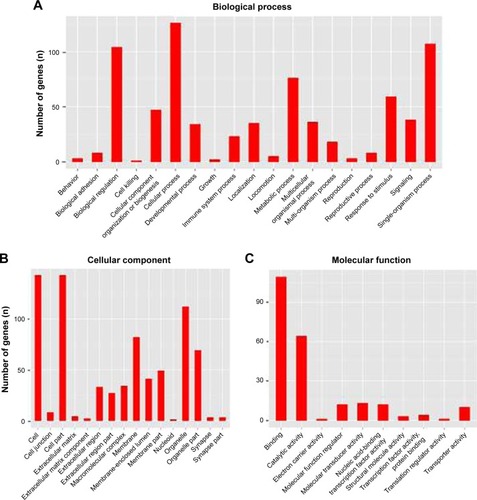
Figure 5 The top 10 GO enrichment analysis of the upregulated mRNAs: (A) biological process, (B) cell component, and (C) molecular function.
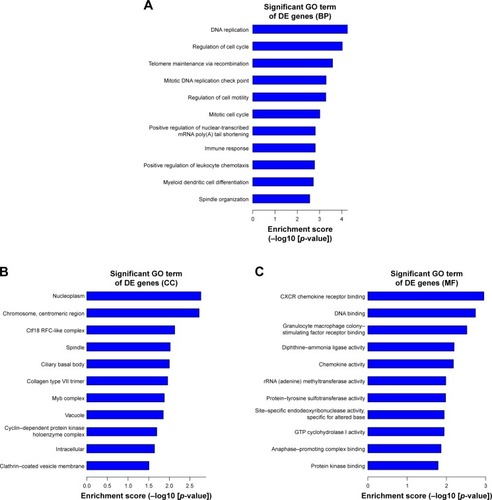
Figure 6 The top 10 GO enrichment analysis of the downregulated mRNAs: (A) biological process, (B) cell component, and (C) molecular function.
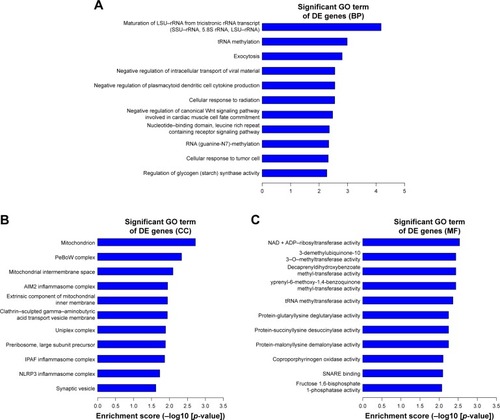
Figure 7 KEGG analysis of the differentially expressed mRNAs. (A) The KEGG analysis results showed that the most enriched pathways included MAPK signaling pathway; those involved in cancer, HTLV-I, and hepatitis B infection; and TNF signaling pathway. (B, C) The top 10 pathway corresponding to the upregulated mRNAs and downregulated mRNAs.
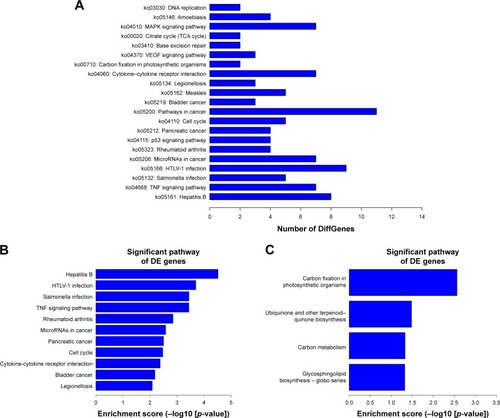
Figure 8 GO and KEGG analyses of the target genes of these differentially expressed lncRNAs. (A) Top 10 GO terms of biological processes for lncRNA-targeted genes. (B) Top 10 pathways corresponding to the lncRNA-targeted genes.
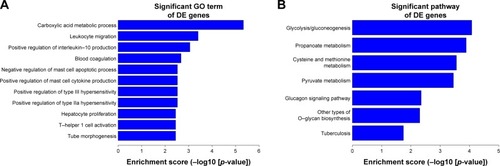
Figure 9 The differentially expressed mRNA-lncRNA coexpression network. Box nodes represent lncRNAs, while circular nodes represent mRNAs. Red represents upregulation, and blue represents downregulation.
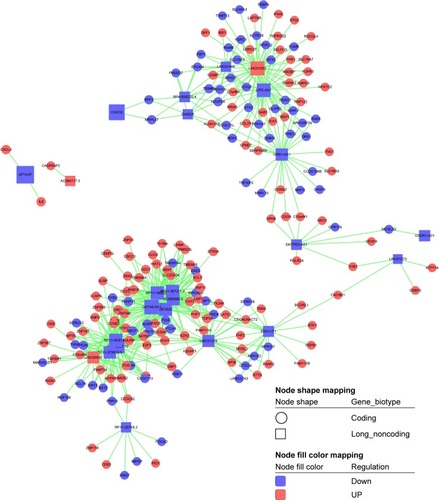
Table 3 The “degree” of lncRNAs in coexpression network (<30° was not shown)
Table S1 Characteristics of breast cancer cell line of MDA-MB-231 and MCF-7
Table S2 siRNA sequences of SIRT7 that were used in this study
Table S3 Primer sequences of lncRNA and mRNA that were determined in this study