Figures & data
Figure 1 Study flow diagram for the process of selecting the final 15 studies.
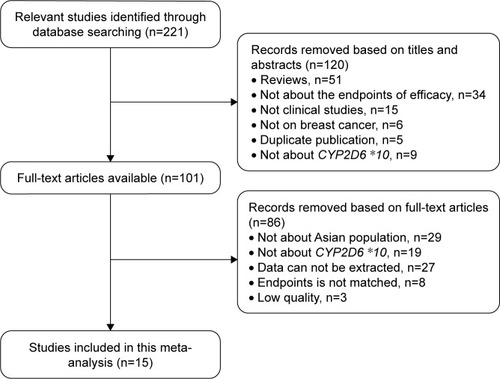
Table 1 Characteristics and quality assessment of the included studies
Figure 2 Forest plot to estimate the effect of CYP2D6 *10 polymorphism on the DFS of breast cancer patients taking tamoxifen.
Abbreviations: DFS, disease-free survival; HR, hazard ratio.
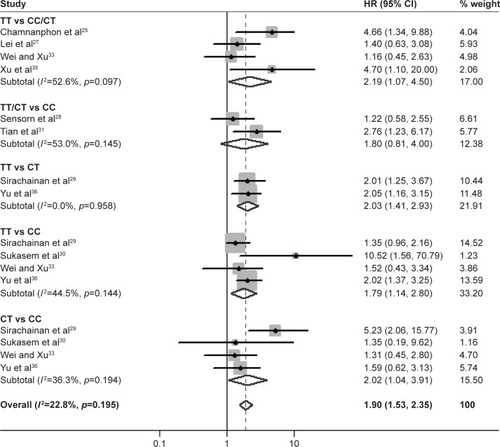
Table 2 Results of the effect of CYP2D6 *10 polymorphism on the DFS of breast cancer patients taking tamoxifen
Table 3 Results of the effect of CYP2D6 *10 polymorphism on the OS of female breast cancer patients taking tamoxifen
Figure 3 Forest plot to estimate the effect of CYP2D6 *10 polymorphism on the recurrence of breast cancer in patients taking tamoxifen in the comparison of (A) TT vs CC; (B) CT/TT vs CC; (C) TT vs CT/TT and (D) T vs C allele.
Abbreviations: CI, confidence interval; OR, odds ratio.
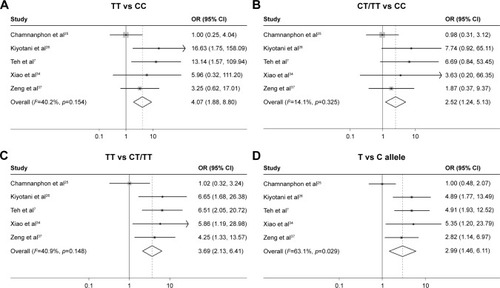
Table 4 Results of the effect of CYP2D6 *10 polymorphism on the recurrence of breast cancer in patients taking tamoxifen
Figure 4 Begg’s funnel plots to examine publication bias for reported comparisons of CYP2D6 *10 polymorphism with recurrence in the comparison of (A) CT vs CC and (B) TT vs CC in Asian breast cancer patients treated with tamoxifen.
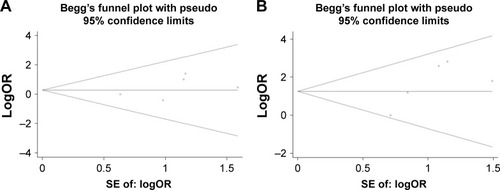
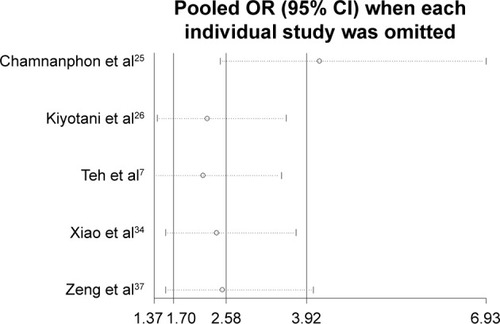
Figure 5 Sensitivity analysis of the comparison of allele genetic model (T vs C allele) in the recurrence analysis.