Figures & data
Table 1 Clinicopathological features and biomarker serum levels of the included subjects
Figure 1 Survival rate of OSCC patients with IGF-1 serum values ≥ 130 ng/mL (circles, n=41) and with IGF-1 serum values <130 ng/mL (squares, n=40; p=0.043).

Figure 2 Survival rate of OSCC patients with IGFBP-3 serum values ≥ 3.1 μg/mL (circles, n=42) and with IGFBP-3 serum values <3.1 μg/mL (squares, n=39; p=0.149).
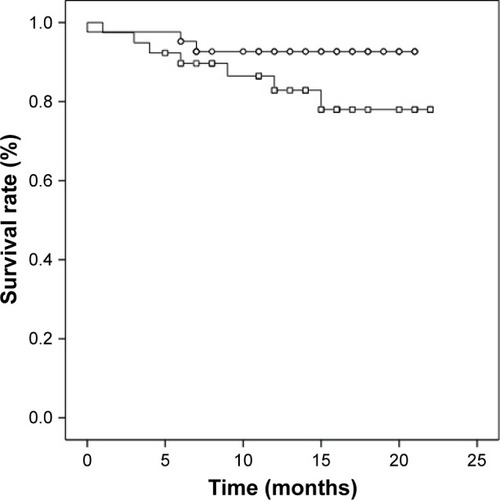
Figure 3 Survival rate of OSCC patients with IGF-1 (≥ 130 ng/mL) and IGFBP-3 (≥ 3.1 μg/mL) serum values (circles, n=51) and with IGF-1 (<130 ng/mL) and IGFBP-3 (<3.1 μg/mL) serum values (squares, n=30; p=0.031).
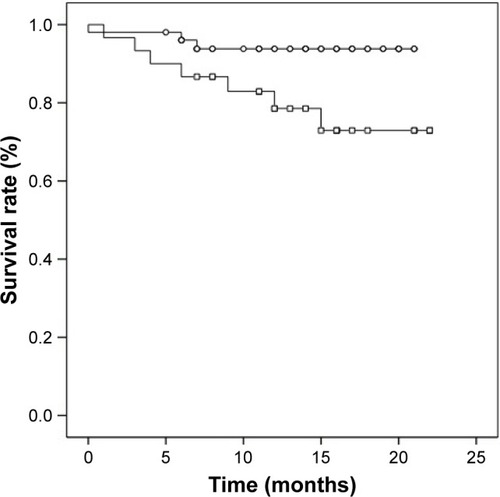
Table 2 Area under the curve for the discrimination of OSCC patients versus healthy controls
Table 3 Area under the curve for the discrimination of OSCC patients versus OPL patients
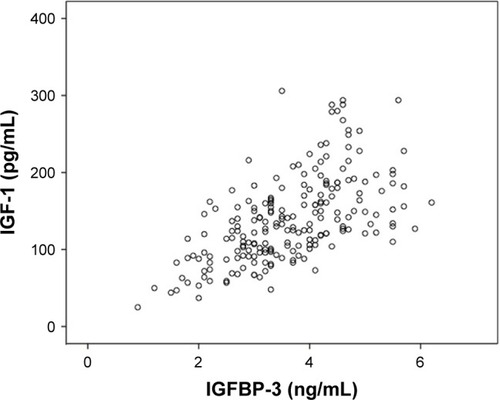
Figure 4 Correlation between serum IGF-1 (pg/mL) and IGFBP-3 (ng/mL) levels.