
Figures & data
Table 1 The top 10 dysregulated mRNAs, miRNAs, lncRNAs
Figure 1 Hierarchical clustering dendrograms of identified co-expressed genes in modules.
Notes: The dendrogram was generated by unsupervised hierarchical clustering of genes using topological overlap. The colored strips below each dendrogram indicate the module designation that was identified through the clusters of co-expressed genes, and assigned the merged module color to the original module color.
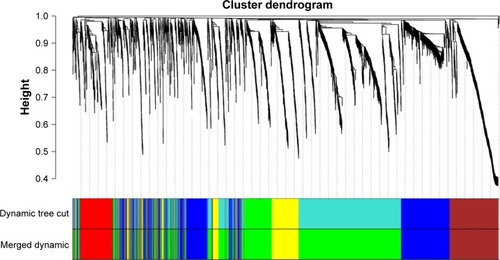
Figure 2 PPI network visualization of modules identifies hub genes.
Notes: Different colors represent the different modules. The hub genes in each module are highlighted with a hexagon shape and purple border.
Abbreviations: MMP, matrix metalloproteinase; PPI, protein–protein interaction.
Abbreviations: MMP, matrix metalloproteinase; PPI, protein–protein interaction.
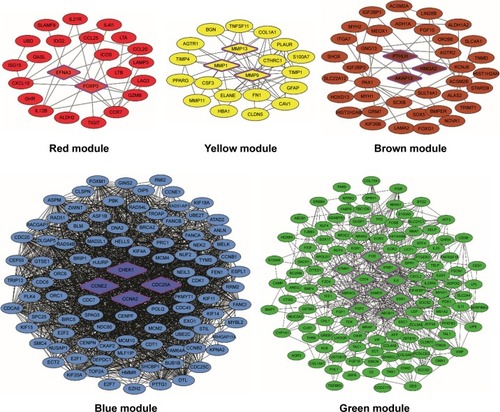
Figure 3 Module–trait relationships.
Notes: Correlation analysis of the identified gene modules with clinical features of triple negative breast cancer. The relationships were analyzed through Pearson’s correlation coefficient (r), accompanied with p-value in brackets.
Abbreviation: ME, module eigengenes.
Abbreviation: ME, module eigengenes.
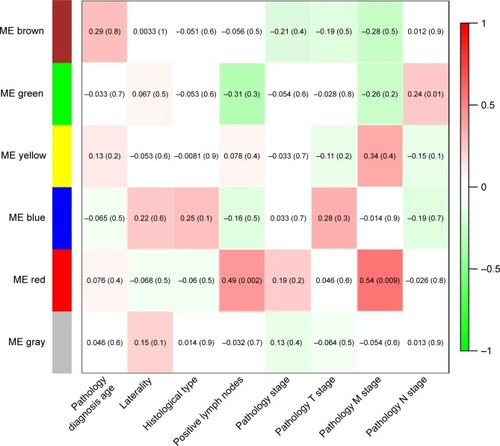
Table 2 The clinical features of triple negative breast cancer patients
Figure 4 Network diagram.
Notes: (A) The ceRNA crosstalk network of TNBC. Key lncRNAs, miRNAs, and hub mRNAs are indicated as turquoise hexagons, red inverted triangles, and slate blue ellipses. (B) Co-expression network of the key lncRNAs and miRNAs mediated in the pathways. Pathways are depicted in rounded rectangle. The number of connections indicate the association between the key miRNAs and lncRNAs with signaling pathways.
Abbreviations: ceRNA, competing endogenous RNA; lncRNA, long non-coding RNA; miRNA, microRNA; TNBC, triple negative breast cancer.
Abbreviations: ceRNA, competing endogenous RNA; lncRNA, long non-coding RNA; miRNA, microRNA; TNBC, triple negative breast cancer.
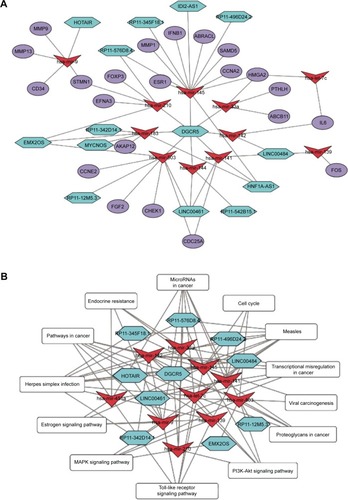
Table 3 Each node of ceRNA crosstalk network
Table 4 KEGG annotation of ceRNA crosstalk network
Figure 5 Survival curve analysis of ceRNA network for overall survival in triple negative breast cancer.
Notes: Two hub DEGs (FOS and AKAP12), and three key miRNAs (hsa-mir-145, hsa-mir-183, hsa-mir-9) are presented (p<0.05). Abscissa axis: overall survival time: days; vertical axis: survival function.
Abbreviations: ceRNA, competing endogenous RNA; DEGs, differentially expressed genes; miRNA, micro RNA.
Abbreviations: ceRNA, competing endogenous RNA; DEGs, differentially expressed genes; miRNA, micro RNA.
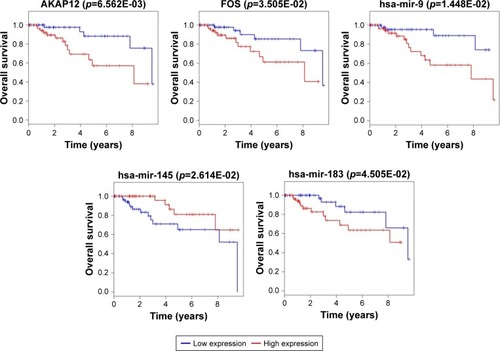
Figure 6 Survival curve analysis of ceRNA network for the overall survival in triple negative breast cancers.
Notes: Six key lncRNAs (LINC00461, RP11-496D24.2, RP11-542B15.1, RP11-576D8.4, EMX2OS, MYCNOS) are presented (p<0.05). Abscissa axis: overall survival time: days; vertical axis: survival function.
Abbreviations: ceRNA, competing endogenous RNA; lncRNA, long non-coding RNA.
Abbreviations: ceRNA, competing endogenous RNA; lncRNA, long non-coding RNA.
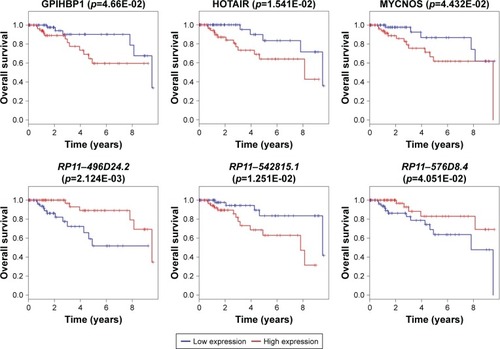
Table S1 The enriched KEGG pathways for each module