Figures & data
Figure 1 SOX18 mRNA expression was correlated with IL-6 mRNA expression in osteosarcoma tissues.
Notes: (A) mRNA levels of SOX18 and IL-6 were significantly higher in osteosarcoma tissues (n=50) than in bone cyst tissues (n=20). (B) Pearson correlation scatter plot of IL-6 and SOX18. (C) Western blot analysis of SOX18, IL-6 and p-STAT3. Representative blots and protein levels relative to GAPDH are shown. *P<0.05, **P<0.01 and ****P<0.0001 as compared with bone cyst tissues.
Abbreviation: IL-6, interleukin-6.
Abbreviation: IL-6, interleukin-6.
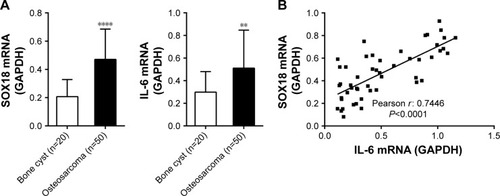
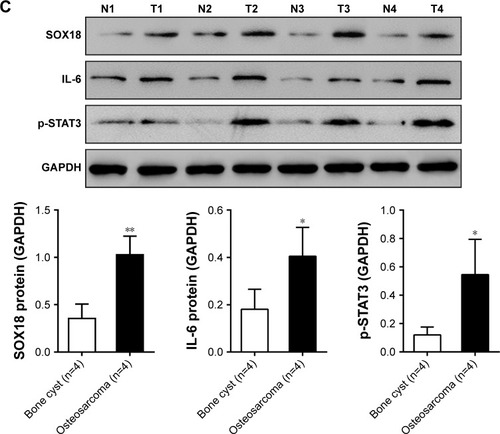
Figure 2 IL-6 increased SOX18 expression.
Notes: (A and B) U-2OS and MG63 cells were exposed with increasing dose of IL-6 (0, 25, 50 and 100 ng/mL) for 24 h. Expression of SOX18 protein (upper panel) and GAPDH (lower panel) was analyzed by Western blot and real-time PCR, respectively (A). Western blot analysis of p-STAT3 is shown (B). *P<0.05, **P<0.01 and ***P<0.001 vs 0 ng/mL group; ##P<0.01 and ###P<0.001 vs 25 ng/mL group and #P<0.05 and $$$P<0.001 vs 50 ng/mL group. (C) U-2OS and MG63 cells were pretreated with 30 μM AG490 (Selleck Chemicals, Houston, TX, USA) or DMSO for 1 h and then exposed to 50 ng/mL IL-6 for 24 h. Expression of SOX18 protein (upper panel) and GAPDH (lower panel) was analyzed. aaaP<0.001 vs WT and bbbP<0.001 vs IL-6 + DMSO.
Abbreviations: PCR, polymerase chain reaction; DMSO, dimethyl sulfoxide; WT, without any treatment; IL-6, interleukin-6.
Abbreviations: PCR, polymerase chain reaction; DMSO, dimethyl sulfoxide; WT, without any treatment; IL-6, interleukin-6.
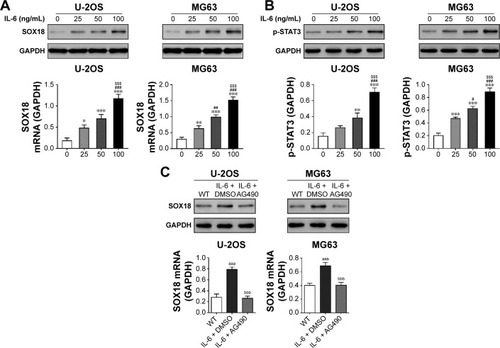
Figure 3 IL-6 promoted osteosarcoma cell growth via SOX18.
Notes: (A) U-2OS and MG63 cells were transduced with SOX18 shRNA (RNAi) or control shRNA (NC). At 48 h after transduction, expression of SOX18 protein (upper panel) and GAPDH (lower panel) was analyzed. (B) U-2OS and (C) MG63 cells seeded in 96-well plates were transduced with shRNAs and treated with or without 50 ng/mL IL-6. After incubating for 0, 24, 48 and 72 h, CCK-8 assay was performed to determine cell proliferation. *P<0.05, **P<0.01 and ***P<0.001 vs WT; #P<0.05 and ###P<0.001 vs RNAi and $$P<0.01 and $$$P<0.001 vs NC + IL-6.
Abbreviations: RNAi, RNA interference; CCK-8, Cell Counting Kit-8; WT, without any treatment; OD, optical density; IL-6, interleukin-6.
Abbreviations: RNAi, RNA interference; CCK-8, Cell Counting Kit-8; WT, without any treatment; OD, optical density; IL-6, interleukin-6.
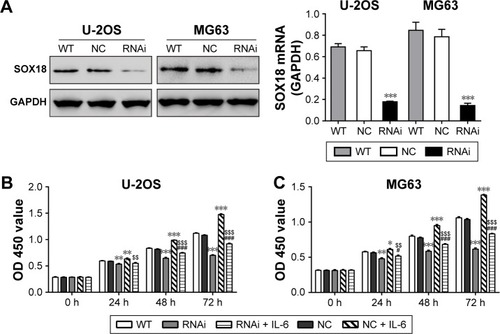
Figure 4 IL-6 exposure attenuated the induction effects of SOX18 knockdown on osteosarcoma cell apoptosis.
Notes: U-2OS (A) and MG63 (B) cells seeded in six-well plates were transduced with SOX18 shRNA (RNAi) or control shRNA (NC) and treated with or without 50 ng/mL IL-6. After incubating for 48 h, cell apoptosis rate was analyzed using flow cytometry. ***P<0.001 vs WT; ###P<0.001 vs RNAi and $$$P<0.001 vs NC + IL-6.
Abbreviations: WT, without any treatment; RNAi, RNA interference; FITC, fluorescein isothiocyanate; PI, propidium iodide; IL-6, interleukin-6.
Abbreviations: WT, without any treatment; RNAi, RNA interference; FITC, fluorescein isothiocyanate; PI, propidium iodide; IL-6, interleukin-6.
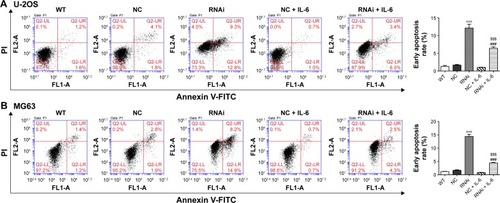
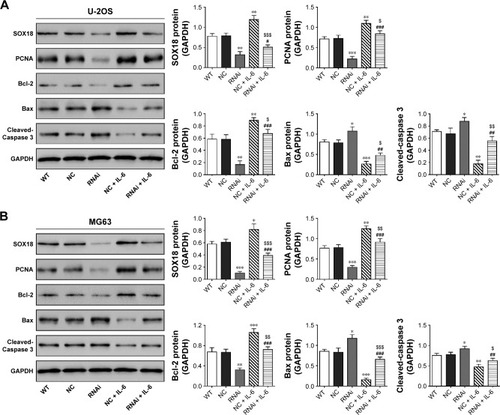
Figure 5 Expression of PCNA, Bcl-2, Bax and Cleaved-Caspase 3.
Notes: U-2OS (A) and MG63 (B) cells seeded in six-well plates were transduced with SOX18 shRNA (RNAi) or control shRNA(NC) and treated with or without 50 ng/mL IL-6. After incubating for 48 h, the protein levels of indicated genes were evaluated. *P<0.05, **P<0.01 and ***P<0.001 vs WT; #P<0.05, ##P<0.01 and ###P<0.001 vs RNAi and $P<0.05, $$P<0.01 and $$$P<0.001 vs NC + IL-6.
Abbreviations: WT, without any treatment; RNAi, RNA interference; IL-6, interleukin-6; PCNA, cell proliferation.
Abbreviations: WT, without any treatment; RNAi, RNA interference; IL-6, interleukin-6; PCNA, cell proliferation.