Figures & data
Figure 1 Effects of PM on osteosarcoma cell viability.
Notes: (A) MNNG, 143B, and NHOst cells were treated with various doses (0–1 μM) of PM for 24, 48, or 72 h, and cell viability was assessed using the RealTime-Glo MT Cell Viability Assay. (B) IC50 values were determined after PM exposure for 24, 48, or 72 h. Data are expressed as the mean ± SD (n=4). **p<0.01 vs IC50 at 24 h in each cell.
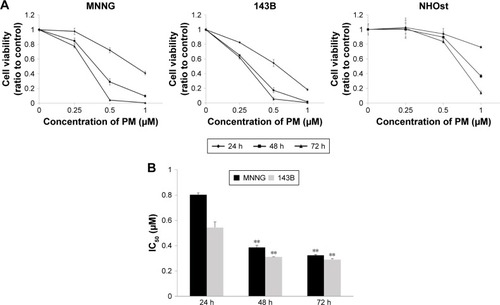
Figure 2 Annexin V-FITC/PI staining of osteosarcoma cells treated with PM.
Notes: (A) MNNG and 143B cells were treated with various doses (0–1 μM) of PM for 24 h, and apoptosis was determined by flow cytometry followed by Annexin V-FITC/PI double staining. (B) Annexin V-FITC-stained cells were considered apoptotic and the percentage of apoptotic cells was calculated. Data are expressed as the mean ± SD (n=4). **p<0.01.
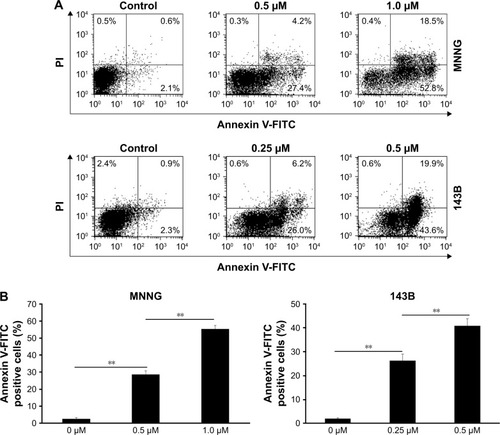
Figure 3 Effects of PM on the activity of caspases 3, 8, and 9 in osteosarcoma cells.
Notes: Caspase activity was measured using a Caspase-Glo assay kit, and the relative ratio is expressed in the bar graph. Caspase 3 activity was measured after 12-h treatment with PM (A); Caspase 8 (B) and 9 (C) activities were measured after 8 h of PM treatment. Data are expressed as the mean ± SD (n=4). *p<0.05, **p<0.01.
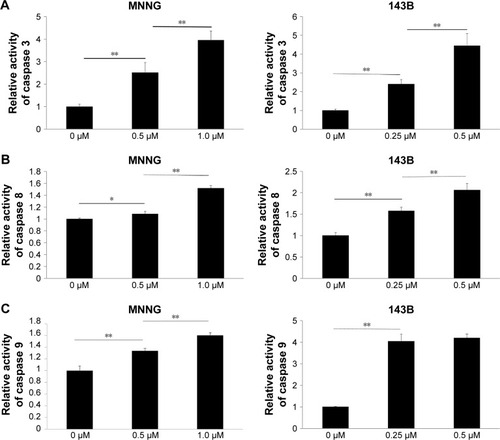
Figure 4 PM inhibits the Akt/mTOR signaling pathway and NF-κB.
Notes: MNNG and 143B cells were treated with PM at concentrations of 0 to 1.0 μM for 24 h. Western blot analysis was conducted using antibodies against phospho-Akt (Ser473), total Akt, Bax, phospho-mTOR (Ser2448), total mTOR, phospho 4E-BP-1, NF-κB p65, phospho NF-κB (Ser536), and Cox2; β-actin was used as a loading control.
Abbreviation: p, phospho.
Abbreviation: p, phospho.
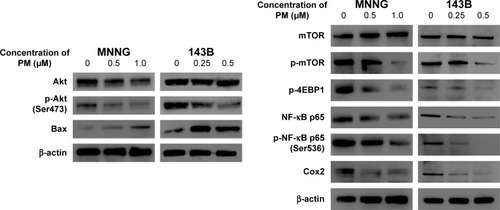
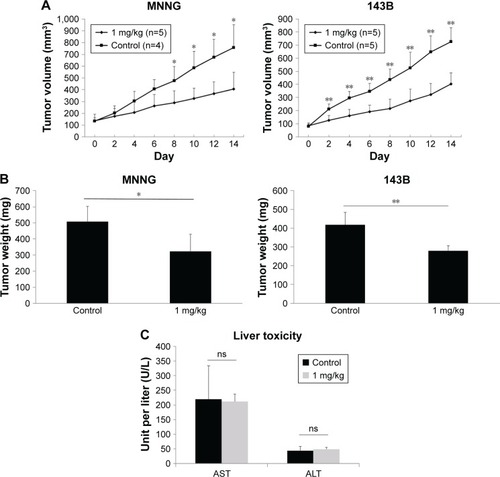
Figure 5 Inhibition of tumor growth by PM in an osteosarcoma xenograft model.
Notes: (A, B) After the tumor volume reached approximately 100 mm3, PM was intraperitoneally administered every other day. (C) Blood samples (n=3) were collected for liver toxicity assessment. Data are expressed as the mean ± SD. *p<0.05, **p<0.01.
Abbreviations: ALT, alanine aminotransferase; AST, aspartate aminotransferase; ns, not significant.
Abbreviations: ALT, alanine aminotransferase; AST, aspartate aminotransferase; ns, not significant.