Figures & data
Figure 1 Isolation of fibroblasts from skin tissue.
Notes: Skin tissue after collection from hospital was cut into small pieces and laid on the surface of culture roux. After 10 days, cells were grown from the edge of the skin fragment (A). After 15 days, cells proliferated and spread out on the surface of culture roux (B).
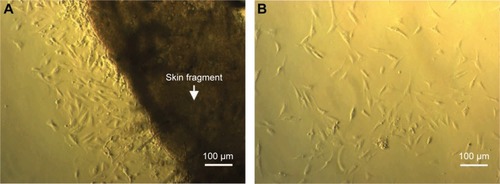
Figure 2 Cytotoxicity of doxorubicin and H. odorata PE on HepG2 and HF.
Notes: HepG2 and HF cells were treated with doxorubicin, from 0 ng/mL (untreated) to 125,000 ng/mL. Similarly, both of these cell lines were treated with H. odorata at concentrations of 0 µg/mL (untreated) to 2,000 µg/mL. After 48 hours of treatment, Alamar Blue was added. The fluorescence of cell samples was measured after 4 hours of incubation with dye. The experiment was conducted three independent times. (A) Inhibition curve of HepG2 and HF treated with doxorubicin for 48 hours. (B) Inhibition curve of HepG2 and HF treated with H. odorata extract for 48 hours. (C) IC50 value of doxorubicin on HepG2 and HF after 24 hours or 48 hours of treatment. (D) IC50 value of H. odorata extract on HepG2 and HF after 24 hours or 48 hours of treatment. Data shown as mean ± standard deviation. ****P<0.0001 for C and **P=0.0053 for D using t-test analysis of Graphpad Prism. Mean ± SEM, n=1 independent experiment for (A and B) and n=3 independent experiments for (C and D).
Abbreviations: HF, human fibroblast; H. odorata, Hopea odorata; PE, plant extract; SEM, standard error of the mean.
Abbreviations: HF, human fibroblast; H. odorata, Hopea odorata; PE, plant extract; SEM, standard error of the mean.
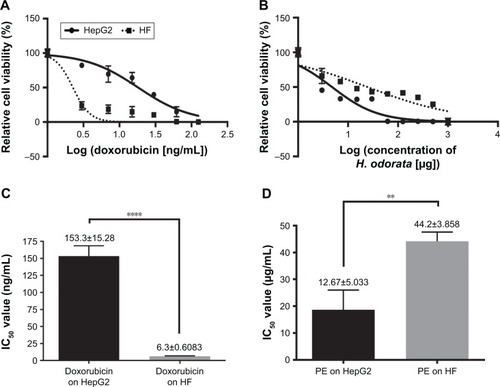
Figure 3 Fluorescence of HepG2 and HF cells after 48 hours of H. odorata treatment.
Notes: HepG2 (A, C, E, G) and HF (B, D, F, H) cells were treated with H. odorata PE at concentrations of 500 µg/mL (G and H), 250 µg/mL (E and F), and 125 µg/mL (C and D). After 48 hours of treatment, cells were stained with fluorescent dye Hoechst 33342 and PI at final concentrations of 1 µg/mL for each dye and then incubated further for 10 minutes at 37°C, 5% CO2. Cells were then observed under a fluorescent microscope at magnification 5×. Hoechst 33342 was detected by DAPI filter, and PI was detected by PI filter.
Abbreviations: DAPI, 4′,6-diamidino-2-phenylindole; HF, human fibroblast; H. odorata, Hopea odorata; PE, plant extract; PI, propidium iodide.
Abbreviations: DAPI, 4′,6-diamidino-2-phenylindole; HF, human fibroblast; H. odorata, Hopea odorata; PE, plant extract; PI, propidium iodide.
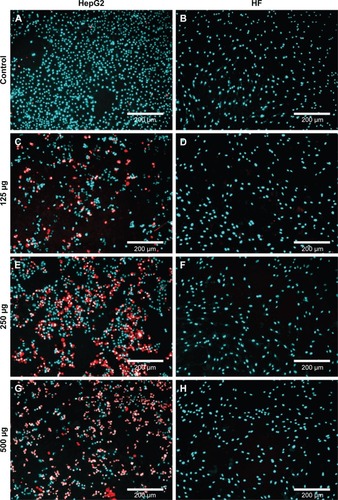
Figure 4 Flow cytometry analysis of treated HepG2 cells.
Notes: HepG2 were treated with H. odorata extract at concentrations of 30 µg/mL, 60 µg/mL, 125 µg/mL, and 250 µg/mL. After 48 hours, cells were stained with Annexin V/PI and incubated for 15 minutes. Cells were then analyzed by CellQuest Pro using a FACSCalibur system.
Abbreviations: H. odorata, Hopea odorata; PE, plant extract; PI, propidium iodide.
Abbreviations: H. odorata, Hopea odorata; PE, plant extract; PI, propidium iodide.
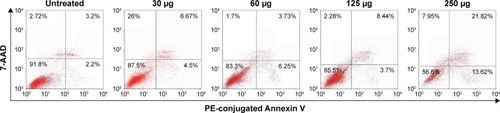
Figure 5 The activation of caspase-3/7 in HepG2.
Notes: HepG2 cells were loaded with CellEvent™ caspase-3/7 green reagent at a concentration of 5 µM and then treated with either 250 µg/mL of H. odorata extract (A, D, G, and J), 100 mM of doxorubicin (B, E, H, and K), or 0.5% methanol solvent control (C, F, I, and L). HepG2 cells were treated for 30 minutes, 2 hours, 4 hours, or 6 hours. Cells were observed under fluorescent microscope for each time point. Untreated cells have minimal fluorescence, while treated cells show a significant increase in fluorescence (shown in green), indicating apoptosis (M, N, and O). H. odorata-treated cells were observed under a microscope after 6 hours of treatment at magnification 40×. Apoptotic HepG2 cells after treatment with H. odorata extract shrunk into a round shape. Unlike neighboring normal cells with smooth shape, the surface of apoptotic HepG2 cells was rough and shrunken.
Abbreviation: H. odorata, Hopea odorata.
Abbreviation: H. odorata, Hopea odorata.
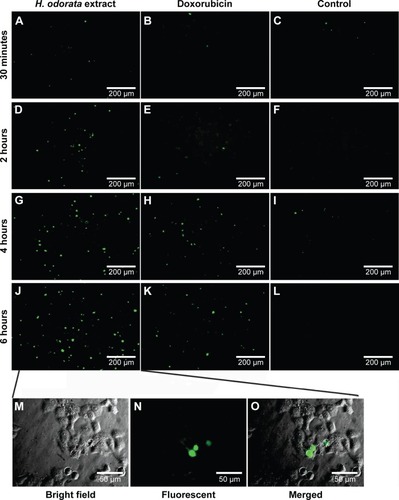
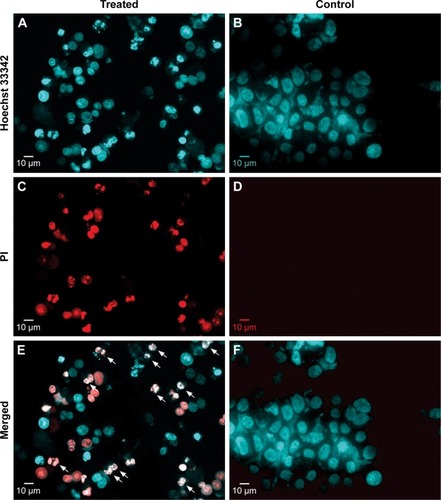
Figure 6 Disintegrated nuclei of H. odorata extract-treated cells.
Notes: After treatment with H. odorata extract (250 µg/mL) for 48 hours, HepG2 cells were harvested and stained with Hoechst 33342 (A and B) and PI (C and D) at a final concentration of 1 µg/mL for each dye. Nuclei of treated cells and control cells were then observed under a fluorescent microscope. Disintegrated nuclei are indicated with white arrows (E and F).
Abbreviations: H. odorata, Hopea odorata; PI, propidium iodide.
Abbreviations: H. odorata, Hopea odorata; PI, propidium iodide.