Figures & data
Figure 1 Immunohistochemical analysis showed positive staining: (A) MET, (B) GLUT1, and (C) PKM2 (magnification ×400). Scale bar: 50 μm.
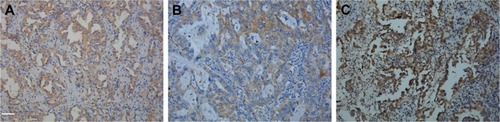
Figure 2 Kaplan–Meier survival analysis according to MET expression. Graph shows that survival time in patients with positive MET expression (n=17) was significantly lower than that in patients with negative MET expression (n=32, P=0.040).
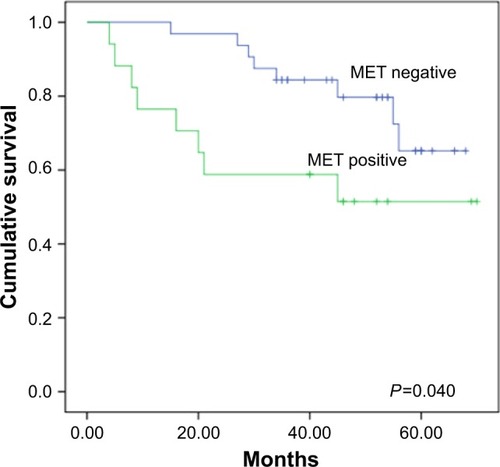
Table 1 Relationship between MET expression and clinical-pathological characteristics (n=57)
Figure 3 Receiver operating characteristic (ROC) curve analysis of SUVmax (maximal standardized uptake value) to predict MET expression. With an SUVmax of 6.2 as the threshold, sensitivity and specificity in the prediction of MET expression were 66.7% and 75%, respectively. The area under the ROC curve was 0.751 (95% CI: 0.609–0.892, P=0.002).
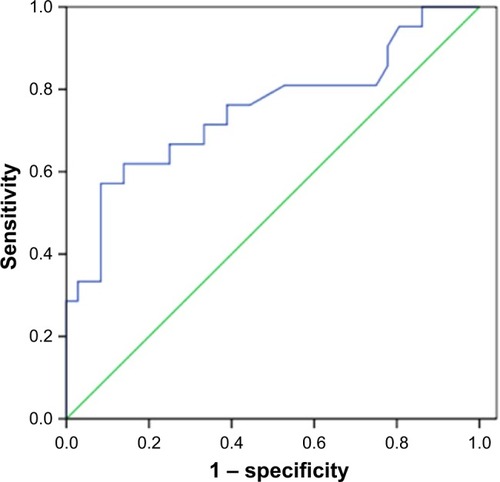
Table 2 Spearman correlation coefficients and P-value between the immunohistochemical staining scores for MET, GLUTI, and PKM2 expression with SUVmax
Table 3 Multivariate analysis of MET expression in 57 patients with lung adenocarcinoma
Figure 4 Graphs show influence of MET knockdown on 18F-FDG (18F-fluorodeoxyglucose) uptake. Influence of MET on 18F-FDG uptake in lung adenocarcinoma (A) A549 and (B) H1299 cell lines. MET knockdown by specific siRNA (small silencing RNA) significantly decreased 18F-FDG uptake in A549 (P=0.035) and H1299 (P=0.010) cells. GLUT1 knockdown by specific siRNA further reduced 18F-FDG uptake in A549 (P=0.011) and H1299 (P=0.001) cells. However, no additive effect was observed when si-MET was combined with si-GLUT1 in A549 (P=0.708) and H1299 (P=0.764) cells. *P<0.05, **P<0.01.
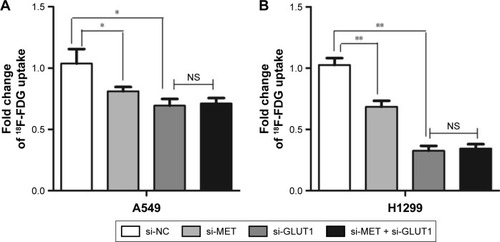
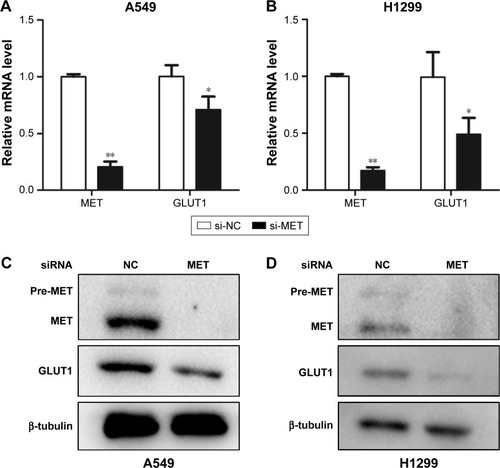
Figure 5 Graphs show influence of MET on expression of GLUT1 in lung adenocarcinoma cells. (A and B) Influence of MET on the mRNA levels of GLUT1 in (A) A549 and (B) H1299 cells. MET knockdown by specific siRNA (small silencing RNA) significantly decreased the mRNA levels of GLUT1 in both A549 (P=0.000) and H1299 (P=0.029) cells. (C and D) Influence of MET on the protein levels of GLUT1 in (C) A549 and (D) H1299 cells. MET knockdown by specific siRNA significantly decreased the protein levels of GLUT1 in both A549 and H1299 cells. *P<0.05, **P<0.01.