Figures & data
Figure 1 Study flow chart showing the process for selecting eligible publications.
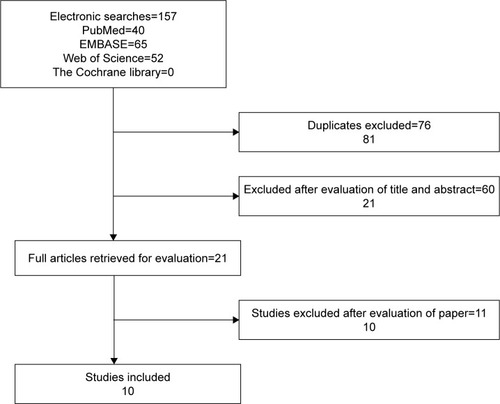
Table 1 Characteristics of the included studies
Figure 2 Forest plot of the overall survival analysis.
Note: Weights are from random-effects analysis.
Abbreviations: CI, confidence interval; ES, effect size.
Abbreviations: CI, confidence interval; ES, effect size.
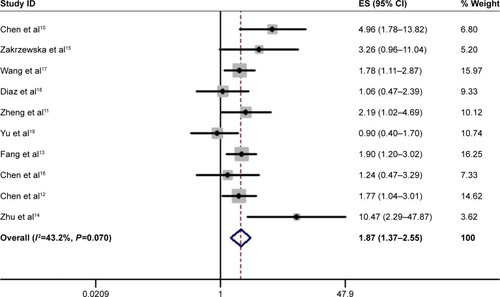
Table 2 The pooled HRs, 95% CIs, heterogeneity, and P-values of overall survival stratified by sample size, ethnicity, sample sources, definition method, tumor type, and statistical mode
Figure 3 Forest plot of disease free survival analysis.
Abbreviations: CI, confidence interval; ES, effect size.
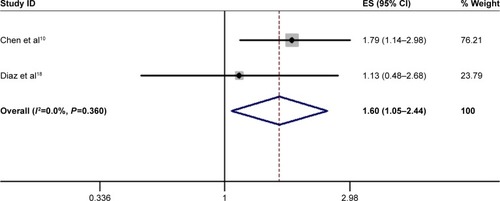
Table 3 Meta-analysis results of the correlation between elevated miR-17-5p expression and multiple clinicopathological characteristics
Figure 4 Sensitivity analysis of overall survival in this meta-analysis.
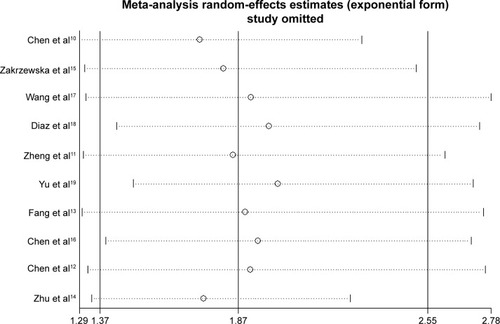
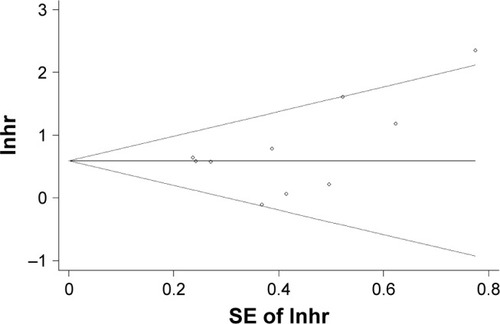
Figure 5 Begg’s funnel plot with pseudo 95% CI of the publication bias for overall survival.
Abbreviations: lnhr, logarithm of the hazard ratio; SE, standard error.