Figures & data
Figure 1 The PGE2 and AA level and the expression of FAK in the clinical samples before and after chemotherapy.
Notes: (A) The AA and PGE2 levels of patient plasma samples were measured by ELISA. The PGE2-to-AA ratios of patient plasma samples before and after chemotherapy were compared. Three independent experiments were carried out. The results are expressed as the mean ± SD of three independent experiments, *P<0.05 compared with the control group. (B) Immunohistochemical staining of FAK and p-FAK in patient ovarian cancer samples before and after chemotherapy. (C) Levels of FAK and p-FAK were quantified according to immunohistochemical staining score.
Abbreviations: PGE2, prostaglandin E2; AA, arachidonic acid; FAK, focal adhesion kinase; ELISA, enzyme-linked immunosorbent assay; SD, standard deviation; p-FAK, phosphorylated FAK; IHC, immunohistochemical.
Abbreviations: PGE2, prostaglandin E2; AA, arachidonic acid; FAK, focal adhesion kinase; ELISA, enzyme-linked immunosorbent assay; SD, standard deviation; p-FAK, phosphorylated FAK; IHC, immunohistochemical.
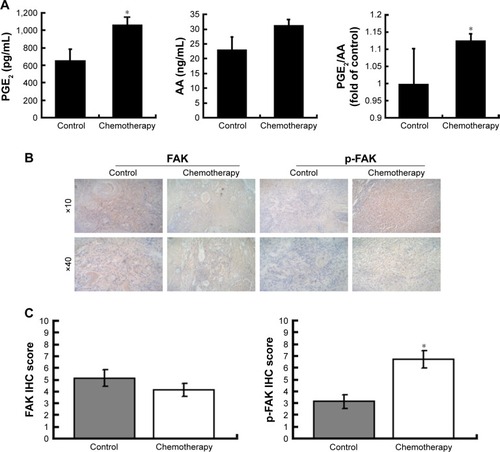
Figure 2 The influence of VP-16-induced apoptosis on the repopulation of SKOV3 cells.
Notes: (A) Crystal violet staining assay of the receptor cells in the control and model groups. (B) The stained cells of the two groups in (A) were solubilized with 1 mL of 33% acetic acid and quantified by the absorbance at 570 nm. The results are expressed as the mean ± SD of three independent experiments, *P<0.05 compared with the control group.
Abbreviations: VP-16, etoposide phosphate; SD, standard deviation.
Abbreviations: VP-16, etoposide phosphate; SD, standard deviation.
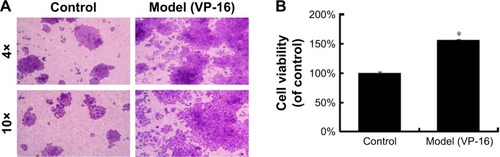
Figure 3 The protein expression of caspase 3, cleaved caspase 3, iPLA2, FAK, and p-FAK in the model of the VP-16-treatment-induced repopulation of SKOV3 cells.
Notes: Western blot analysis of caspase 3, cleaved caspase 3, and iPLA2 expression in feeder cells and of FAK and p-FAK expression in receptor cells. Each bar represents the mean ± SD of three independent experiments, n=3, *P<0.05 compared with the control group.
Abbreviations: iPLA2, cytosolic calcium-independent phospholipase A2; FAK, focal adhesion kinase; p-FAK, phosphorylated FAK; VP-16, etoposide phosphate; SD, standard deviation.
Abbreviations: iPLA2, cytosolic calcium-independent phospholipase A2; FAK, focal adhesion kinase; p-FAK, phosphorylated FAK; VP-16, etoposide phosphate; SD, standard deviation.
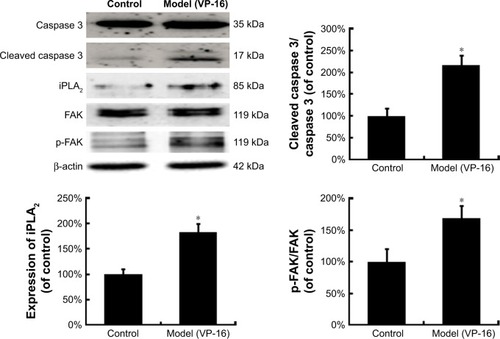
Figure 4 The AA and PGE2 levels within the Transwell system.
Notes: (A and B) The AA and PGE2 levels of the supernatants collected each day from the Transwell system during the 10-day incubation were measured by ELISA. (C) The PGE2-to-AA ratios were calculated. Three independent experiments were carried out. The results are expressed as the mean ± SD, n=3, *P<0.05 compared with the control group.
Abbreviations: AA, arachidonic acid; PGE2, prostaglandin E2; ELISA, enzyme-linked immunosorbent assay; SD, standard deviation.
Abbreviations: AA, arachidonic acid; PGE2, prostaglandin E2; ELISA, enzyme-linked immunosorbent assay; SD, standard deviation.
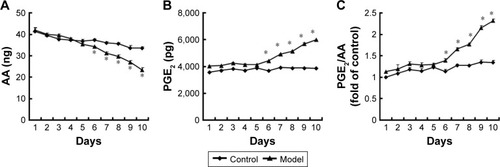
Figure 5 The influence of the FAK inhibitor PF562271 (PF) on the VP-16-induced repopulation of SKOV3 cells.
Notes: (A) Crystal violet staining assay of the receptor cells with the FAK inhibitor PF562271 (PF) added to the system. (B) The stained cells of the four groups in A were solubilized with 1 mL of 33% acetic acid and quantified by the absorbance at 570 nm. The results are expressed as the mean ± SD of three independent experiments, n=3, *P<0.05 compared with the control group, #P<0.05 compared with the model group.
Abbreviations: FAK, focal adhesion kinase; VP-16, etoposide phosphate; SD, standard deviation.
Abbreviations: FAK, focal adhesion kinase; VP-16, etoposide phosphate; SD, standard deviation.
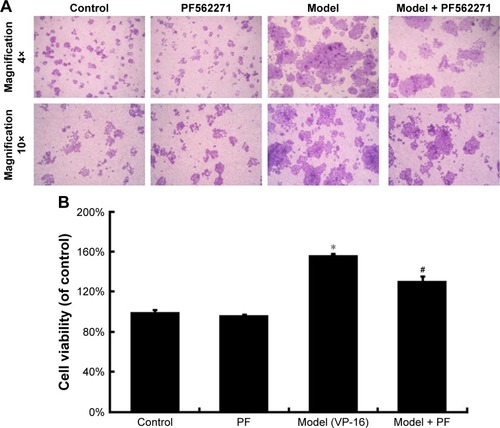
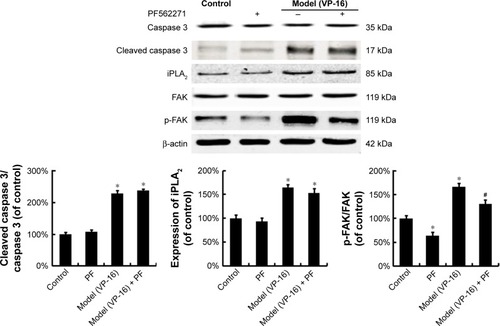
Figure 6 The influence of the FAK inhibitor PF562271 on the expression of FAK, p-FAK, caspase 3, and iPLA2.
Notes: Western blot analysis of caspase 3, cleaved caspase 3, and iPLA2 in feeder cells and of FAK and p-FAK in receptor cells with the FAK inhibitor PF562271 (PF) added to the system. Each bar represents the mean ± SD of three independent experiments, *P<0.05 compared with the control group, #P<0.05 compared with the model group.
Abbreviations: FAK, focal adhesion kinase; p-FAK, phosphorylated FAK; iPLA2, cytosolic calcium-independent phospholipase A2; SD, standard deviation; VP-16, etoposide phosphate.
Abbreviations: FAK, focal adhesion kinase; p-FAK, phosphorylated FAK; iPLA2, cytosolic calcium-independent phospholipase A2; SD, standard deviation; VP-16, etoposide phosphate.