Figures & data
Table 1 Characteristics of 73 patients
Table 2 Participants’ characteristics with 66 lung benign diseases and 66 lung adenocarcinomas presenting with GGNs
Figure 1 Heat map of expression data of the 23 miRNAs.
Notes: Heat map of expression data of the 23 miRNAs found to be significantly differentially expressed by next-generation sequencing. The three left columns represent the three adenocarcinoma tumor samples from patients 1, 2 and 3, respectively, and the three columns on the right represent the three adjacent normal (N) paired tissues from patients 1, 2 and 3, respectively. High expression levels are depicted by red and low by blue.
Abbreviation: miRNAs, microRNAs.
Abbreviation: miRNAs, microRNAs.
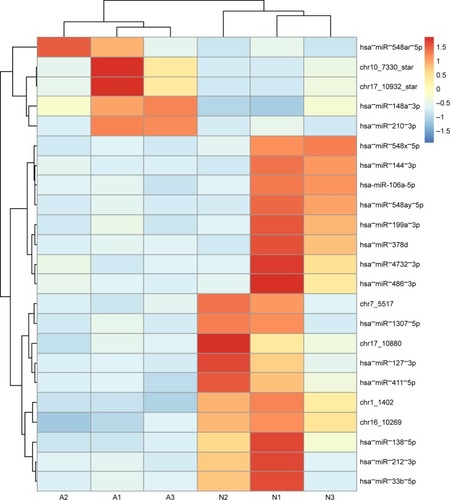
Figure 2 AUC of 23 different microRNAs in tumor and non-tumor tissue by qRT-PCR.
Note: *P<0.05.
Abbreviations: AUC, area under the curve; miRNAs, microRNAs; qRT-PCR, quantitative real-time polymerase chain reaction.
Abbreviations: AUC, area under the curve; miRNAs, microRNAs; qRT-PCR, quantitative real-time polymerase chain reaction.
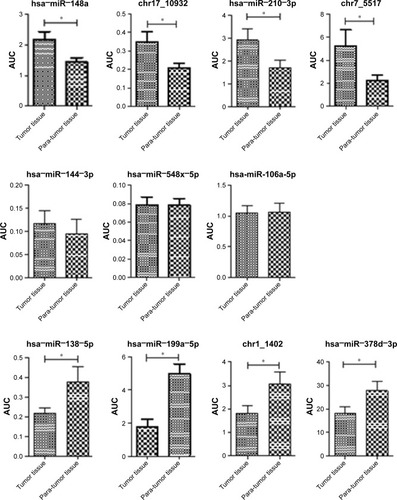
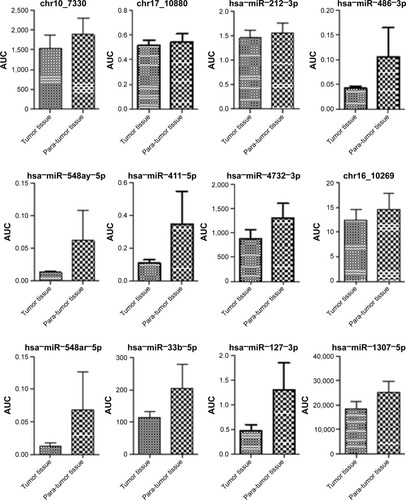
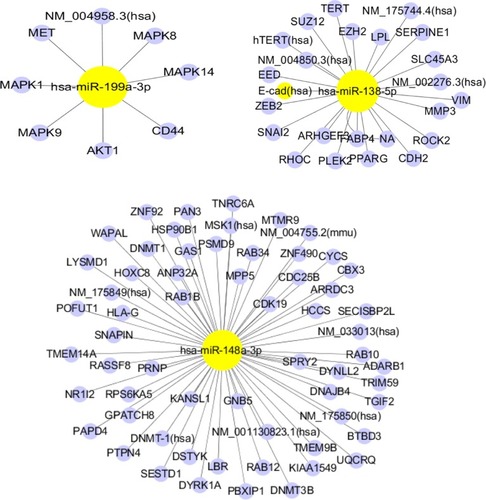
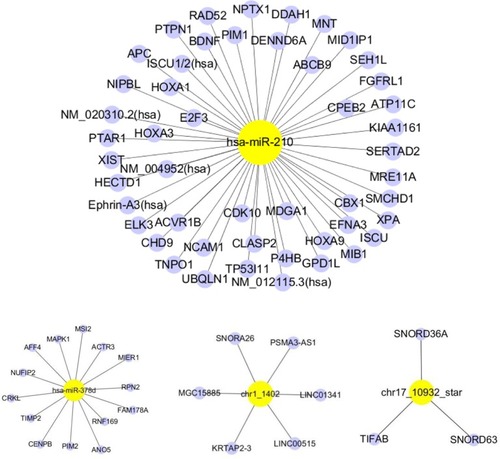
Figure 3 miRNA target genes.
Note: Each network represents the interaction of a miRNA (yellow) and its target genes (blue).
Abbreviation: miRNA, microRNA.
Abbreviation: miRNA, microRNA.