
Figures & data
Table 1 Baseline characteristics of patients
Table 2 The treatment modalities of chemotherapy and nimotuzumab combined with IMRT in all patients
Figure 1 Kaplan–Meier survival curve of PFS (enrolled population).
Abbreviation: PFS, progression-free survival.
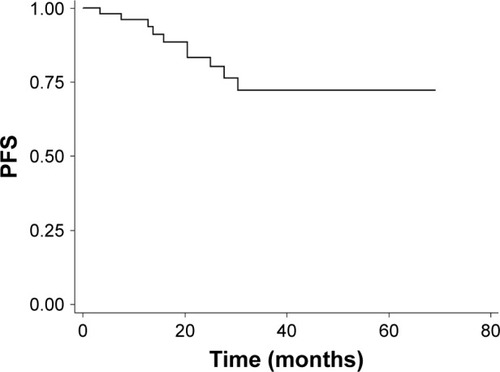
Figure 2 Kaplan–Meier survival curve of OS (enrolled population).
Abbreviation: OS, overall survival.
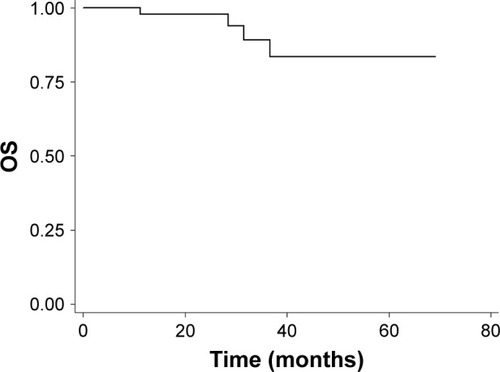
Figure 3 Kaplan–Meier survival curves of PFS for patients receiving ≥6 versus <6 cycles of nimotuzumab.
Abbreviation: PFS, progression-free survival.
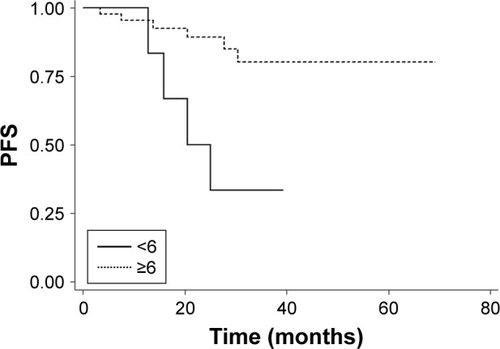
Figure 4 Kaplan–Meier survival curves of PFS for patients with stage II–III versus stage IV.
Abbreviation: PFS, progression-free survival.
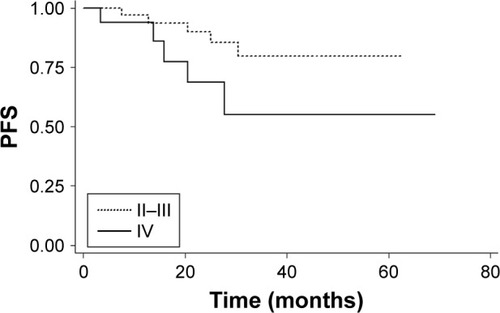
Table 3 Impact of prognostic factors on PFS by univariate and multivariate analysis
Table 4 The frequency of acute toxicities during IMRT plus nimotuzumab
Table 5 The frequency of grade 3–4 acute adverse events during IMRT plus nimotuzumab with or without CCT