Figures & data
Figure 1 miR-495 was downregulated in melanoma tissues and cell lines. (A) qPCR analysis of miR-495 expression in 15 paired melanoma tissues and adjacent normal tissues. (B) qPCR analysis of miR-495 expression in primary human epidermal melanocytes (PEM) and various melanoma cell lines (A7, WM-115, MeWo, SK-MEL-28, A375). Data are presented as mean ± SD (n=3). Each experiment was performed in triplicate. *P<0.05, ***P<0.001.
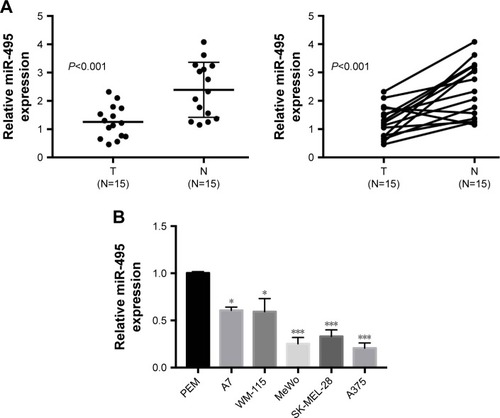
Figure 2 miR-495 inhibits melanoma cell proliferation, migration, invasion, and colony formation in vitro. (A) A375 and MeWo cells were transfected with miR-495 mimics, negative control (miR-NC), negative control inhibitor (NC inhibitor), or miR-495 inhibitor for 24 hours, then the expression of miR-495 was quantified by qRT-PCR. (B) miR-495 mimics, miR-NC, NC inhibitor or miR-495 inhibitor-transfected A375, and MeWo cells were subjected to MTT assay. (C) miR-495 mimics, miR-NC, NC inhibitor or miR-495 inhibitor-transfected A375, and MeWo cells were subjected to wound healing assay. (D) miR-495 mimics, miR-NC, NC inhibitor or miR-495 inhibitor-transfected A375, and MeWo cells were subjected to transwell assay. (E) miR-495 mimics, miR-NC, NC inhibitor or miR-495 inhibitor-transfected A375, and MeWo cells were subjected to colony formation assay. Data are presented as mean ± SD (n=3). All experiments were performed three times, and representative images are presented. *P<0.05, **P<0.01, ***P<0.001.
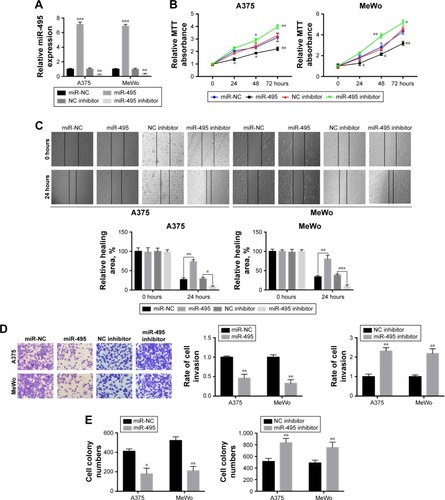
Figure 3 Overexpression of miR-495 promotes apoptosis in melanoma cells. A375 and MeWo cells were transfected with miR-NC or miR-495 mimics for 24 cells. (A) Apoptosis rates were analyzed. (B) Caspase-3 activity was analyzed. (C) Total proteins were subjected to Western blot analysis with indicated antibodies. (D) Western blot results were quantitatively analyzed. Data are presented as the mean ± SD (n=3). All experiments were performed three times, and representative images are presented. **P<0.01, ***P<0.001.
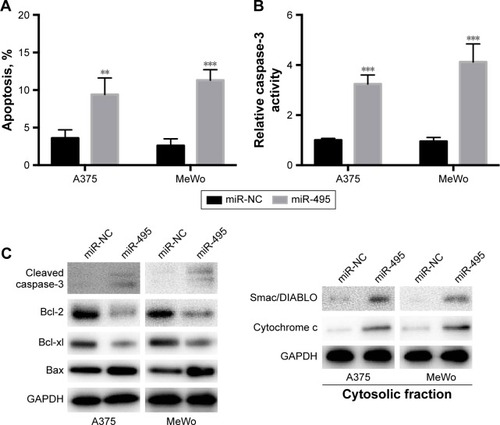
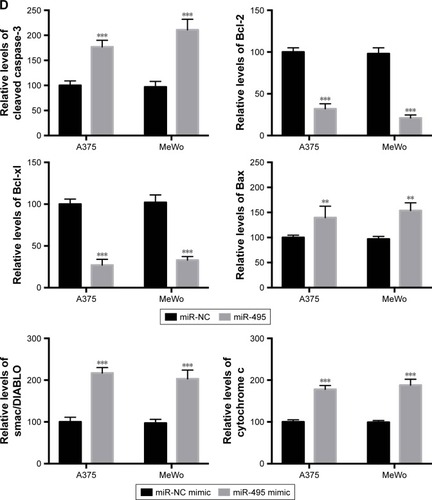
Figure 4 Pre-B-cell leukemia transcription factor 3 (PBX3) is a direct target of miR-495 in melanoma cells. (A) Human PBX3 3′UTR binding site for miR-495. (B) miR-495 targeted the wild-type but not the mutant 3′UTR of PBX3. (C) Overexpression of miR-495 repressed PBX3 mRNA expression level (left) and protein level (middle and right) in A375 and MeWo cells. Data are presented as mean ± SD (n=3). All experiments were performed three times, and representative images are presented. **P<0.01.
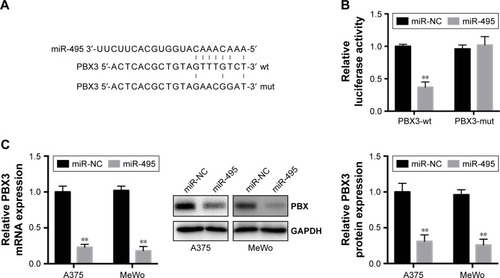
Figure 5 Silencing of pre-B-cell leukemia transcription factor 3 (PBX3)-inhibited cell proliferation, migration, and invasion in melanoma cells. (A) A375 and MeWo cells were transfected with negative control siRNA (si-NC) or siRNA against PBX3 (si-PBX3) for 24 hours, the mRNA expression levels of PBX3 in both the cells were examined by RT-qPCR and (B) the protein levels of PBX3 in both the cells were examined by Western blot. (C) A375 and MeWo cells were transfected with si-NC or si-PBX3 for indicated time, and cell proliferation was analyzed by MTT assay. (D) A375 and MeWo cells were transfected with si-NC or by transwell assay. (E) Cell migration was analyzed by si-PBX3 for 24 hours, and cell invasion was analyzed by wound healing assay. Data are presented as mean ± SD (n=3). All experiments were performed three times, and representative images are presented. *P<0.05, **P<0.01, ***P<0.001.
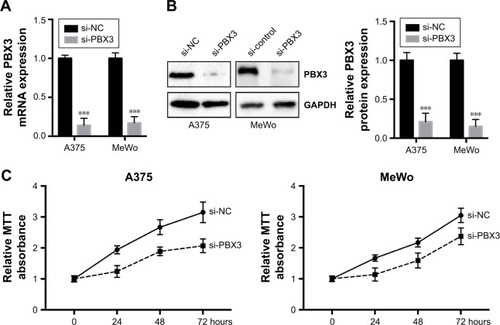
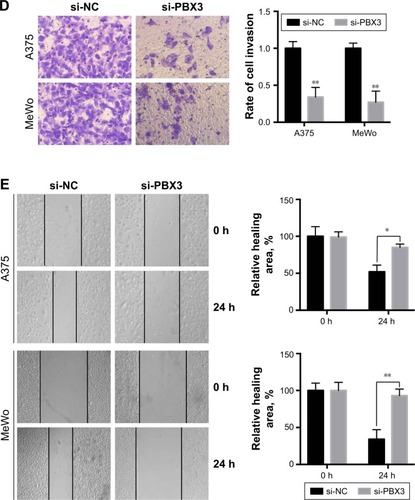
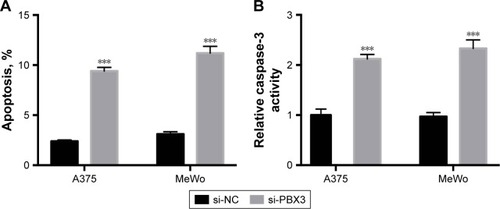
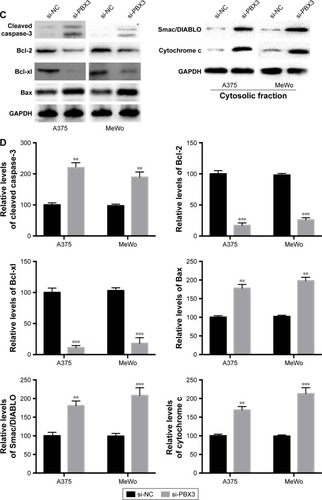
Figure 6 Knockdown of pre-B-cell leukemia transcription factor 3 (PBX3) promotes apoptosis in melanoma cells. Melanoma A375 and MeWo cells were transfected with negative control siRNA (si-NC) or siRNA against PBX3 (si-PBX3) for 24 hours. (A) Cell apoptosis rates were analyzed. (B) Caspase-3 activity was analyzed. (C) Total lysates were subjected to Western blot analysis with the indicated antibodies. (D) Western blot results were quantitatively analyzed. Data are presented as mean ± SD (n=3). All experiments were performed three times, and representative images are presented. **P<0.01, ***P<0.001.