Figures & data
Figure 1 Higher expression level of IL13Rα2 and VEGF were detected in PTC tissues.
Notes: Higher mRNA levels of IL13Rα2 (A) and VEGF (B) were measured in PTC tissue samples (n=45) by using real-time PCR compared with paracancerous tissues (n=45). **P<0.01, compared with paracancerous tissues. (C) Pearson’s correlation analysis between IL13Rα2 and VEGF mRNA expression in PTC tissues (n=45). Protein levels of IL13Rα2 (D) and VEGF (E) in PTC and paracancerous tissues were evaluated by using immunohistochemistry analysis. Smaller staining areas of IL13Rα2 and VEGF were observed in paracancerous tissues, indicating the overexpression of IL13Rα2 and VEGF in PTC tissues.
Abbreviations: IL13Rα2, interleukin-13 receptor α2; PCR, polymerase chain reaction; PTC, papillary thyroid carcinoma; VEGF, vascular endothelial growth factor.
Abbreviations: IL13Rα2, interleukin-13 receptor α2; PCR, polymerase chain reaction; PTC, papillary thyroid carcinoma; VEGF, vascular endothelial growth factor.
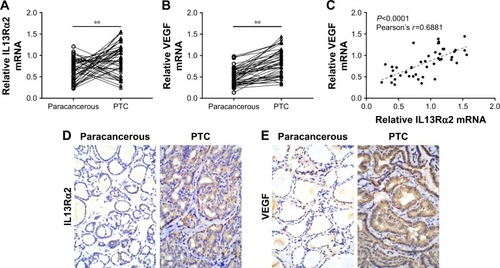
Figure 2 Knockdown of IL13Rα2 inhibited cell proliferation.
Notes: (A) The mRNA expression level of IL13Rα2 was measured by using real-time PCR in TPC-1 and ARO cells with IL13Rα2 siRNA transfection (siRNA-1 or siRNA-2). (B) The IL13Rα2 protein expression was measured by Western blot in TPC-1 and ARO cells after the transfection with IL13Rα2 siRNAs (siRNA-1 and siRNA-2). (C) IL13Rα2 siRNA inhibited cell proliferation in TPC-1 and ARO cells. **P<0.01, ***P<0.001, compared with the NC group. ##P<0.01, ###P<0.001, compared with the NC group (n=3).
Abbreviations: IL13Rα2, interleukin-13 receptor α2; NC, negative control siRNA; PCR, polymerase chain reaction.
Abbreviations: IL13Rα2, interleukin-13 receptor α2; NC, negative control siRNA; PCR, polymerase chain reaction.
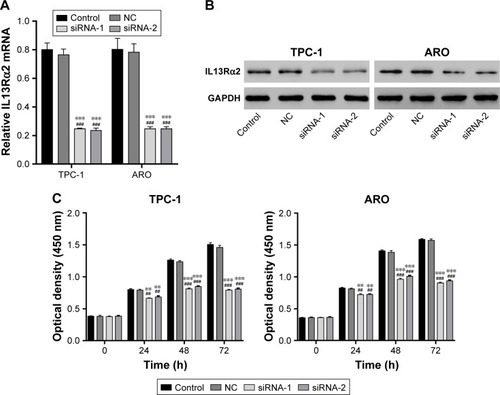
Figure 3 Knockdown of IL13Rα2 induced cell apoptosis in PTC cells.
Notes: (A) TPC-1 and ARO cells with IL13Rα2 knocked down showed a significant increase in apoptosis rate. (B) Increased activity of Caspase 3 and Caspase 9 were detected in TPC-1 and ARO cells after the knockdown of IL13Rα2. (C) The expression of cleaved Caspase 3 and PARP was determined by Western blot. ***P<0.001, compared with the NC group. ###P<0.001, compared with the NC group (n=3).
Abbreviations: GAPDH, glyceraldehyde-3-phosphate dehydrogenase; IL13Rα2, interleukin-13 receptor α2; NC, negative control siRNA; PARP, poly (ADP)-ribose polymerase; PTC, papillary thyroid carcinoma.
Abbreviations: GAPDH, glyceraldehyde-3-phosphate dehydrogenase; IL13Rα2, interleukin-13 receptor α2; NC, negative control siRNA; PARP, poly (ADP)-ribose polymerase; PTC, papillary thyroid carcinoma.
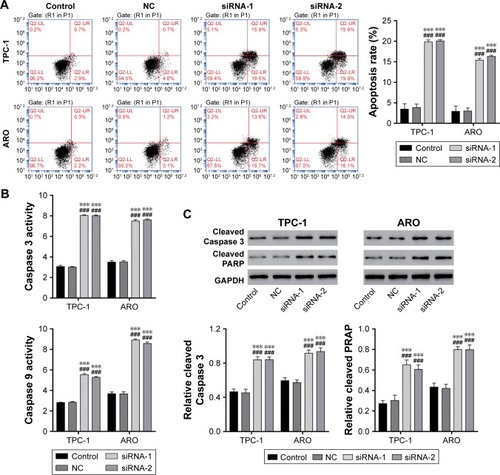
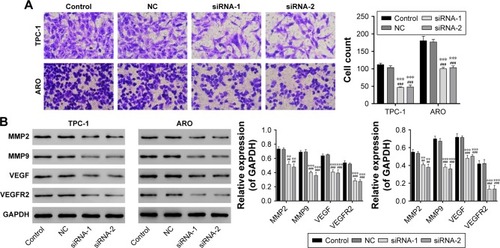
Figure 4 IL13Rα2 siRNA inhibited cell invasion in TPC-1 cells.
Notes: (A) Downregulation of invasion rate was detected in TPC-1 and ARO cells after the transfection with IL13Rα2 siRNAs (siRNA-1 and siRNA-2). (B) Expression levels of VEGF, VEGFR2, MMP2, and MMP9 in TPC-1 and ARO cells were measured by using Western blot analysis. **P<0.01, ***P<0.001, compared with the NC group. ##P<0.01, ###P<0.001, compared with the NC group (n=3).
Abbreviations: GAPDH, glyceraldehyde-3-phosphate dehydrogenase; IL13Rα2, interleukin-13 receptor α2; MMP2, matrix metallopeptidase 2; MMP9, matrix metallopeptidase 9; NC, negative control siRNA; VEGF, vascular endothelial growth factor; VEGFR2, VEGF receptor 2.
Abbreviations: GAPDH, glyceraldehyde-3-phosphate dehydrogenase; IL13Rα2, interleukin-13 receptor α2; MMP2, matrix metallopeptidase 2; MMP9, matrix metallopeptidase 9; NC, negative control siRNA; VEGF, vascular endothelial growth factor; VEGFR2, VEGF receptor 2.