Figures & data
Table 1 Patient baseline characteristics
Table 2 Methodological quality evaluation (NOS)
Figure 1 Meta-analysis of PFS for interim PET/CT visual evaluation of aggressive non-Hodgkin’s lymphoma (subgroups = interpretation criteria).
Abbreviations: IHP, International Harmonization Project; PFS, progression-free survival; PET/CT, positron emission tomography/computed tomography; HR, hazard ratio; CI, confidence interval; TE, estimate of treatment effect; seTE, standard error of treatment estimate.
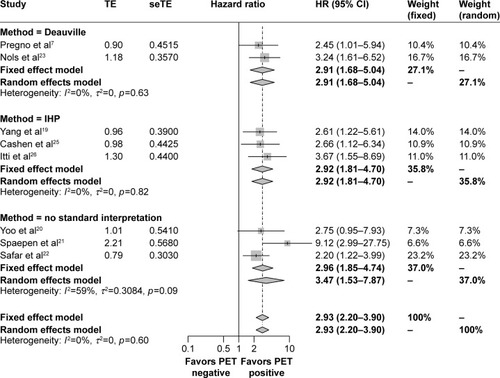
Figure 2 Meta-analysis of PFS for interim PET/CT visual evaluation of aggressive non-Hodgkin’s lymphoma (subgroups = number of chemotherapy cycles before PET/CT).
Abbreviations: PFS, progression-free survival; PET/CT, positron emission tomography/computed tomography; HR, hazard ratio; CI, confidence interval; TE, estimate of treatment effect; seTE, standard error of treatment estimate.
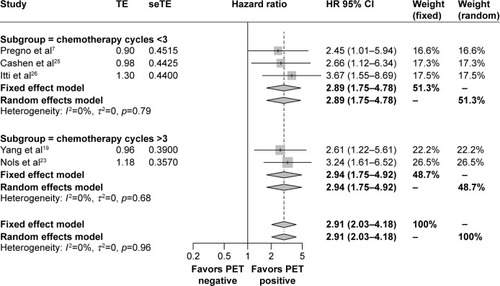
Figure 3 Meta-analysis of OS for interim PET/CT visual evaluation of aggressive non-Hodgkin’s lymphoma (subgroups = interpretation criteria).
Abbreviations: OS, overall survival; PET/CT, positron emission tomography/computed tomography; HR, hazard ratio; CI, confidence interval; IHP, International Harmonization Project; TE, estimate of treatment effect; seTE, standard error of treatment estimate.
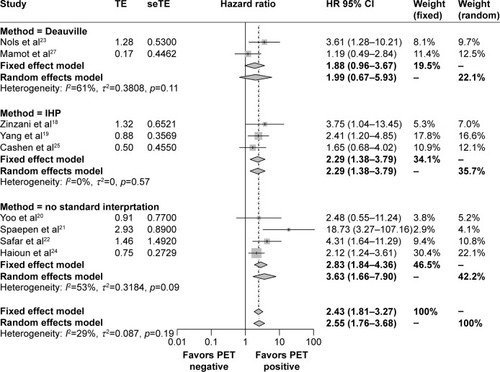
Figure 4 Meta-analysis of OS in interim PET/CT visual evaluation of aggressive non-Hodgkin’s lymphoma (subgroups = number of chemotherapy cycles before PET/CT).
Abbreviations: OS, overall survival; PET/CT, positron emission tomography/computed tomography; HR, hazard ratio; CI, confidence interval; TE, estimate of treatment effect; seTE, standard error of treatment estimate.
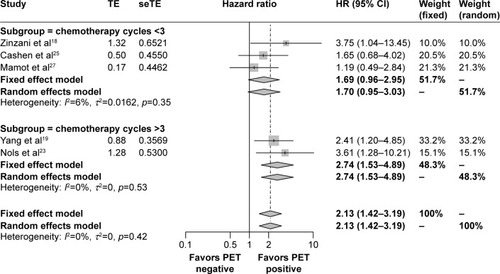
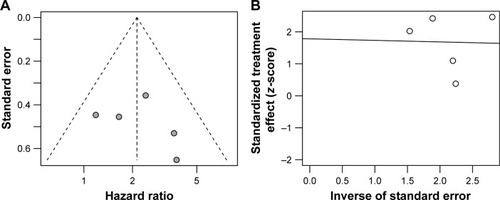
Figure 5 Publication bias funnel map (A) and Egger’s test (B) of the data shown in .
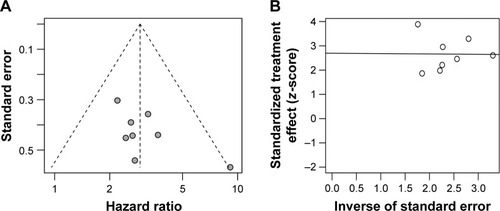
Figure 6 Publication bias funnel map (A) and Egger’s test (B) of the data shown in .
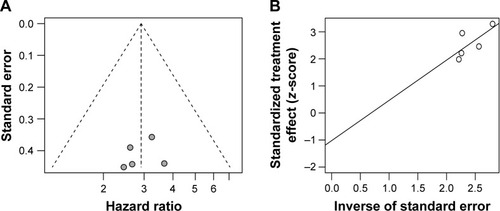
Figure 7 Publication bias funnel map (A) and Egger’s test (B) of the data shown in .
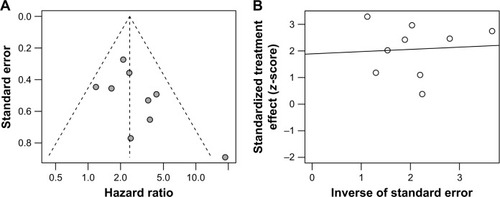
Figure 8 Publication bias funnel map (A) and Egger’s test (B) of the data shown in .