Figures & data
Table 1 The main characteristics of the included 17 studies in the meta-analysis
Figure 1 Flow diagram of the study selection process.
Abbreviation: HR, hazard ratio.
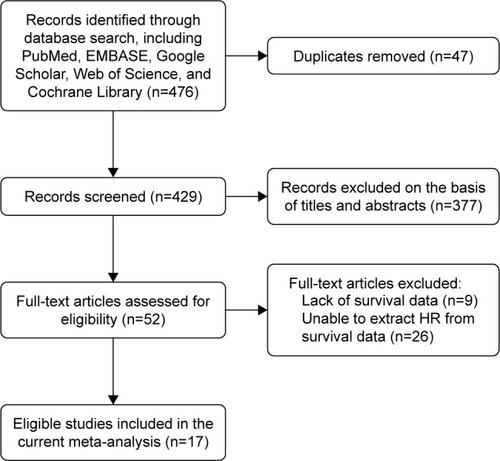
Figure 2 Meta-analysis of pooled HRs of OS in gliomas.
Note: Weights are from random-effects analysis.
Abbreviations: CI, confidence interval; HR, hazard ratio; OS, overall survival.
Abbreviations: CI, confidence interval; HR, hazard ratio; OS, overall survival.
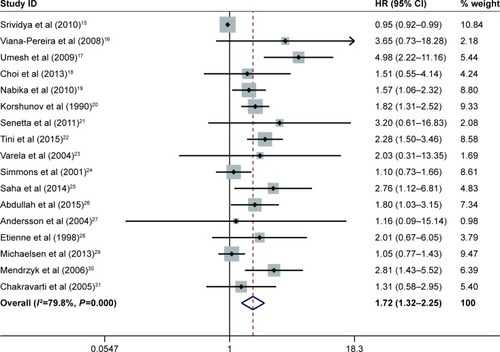
Table 2 Meta-analysis results of subgroups for the OS of gliomas
Table 3 Meta-analysis results of subgroups for the OS of GBMs
Figure 3 Meta-analysis of pooled HRs of OS in GBM.
Note: Weights are from random-effects analysis.
Abbreviations: CI, confidence interval; GBM, glioblastoma multiforme; HR, hazard ratio; OS, overall survival.
Abbreviations: CI, confidence interval; GBM, glioblastoma multiforme; HR, hazard ratio; OS, overall survival.
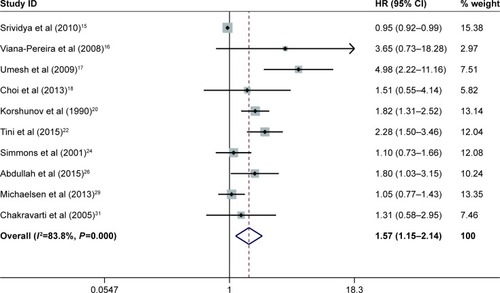
Figure 4 Sensitivity analysis of the relationship between EGFR expression and overall survival in glioma patients.
Abbreviations: CI, confidence interval; EGFR, epidermal growth factor receptor.
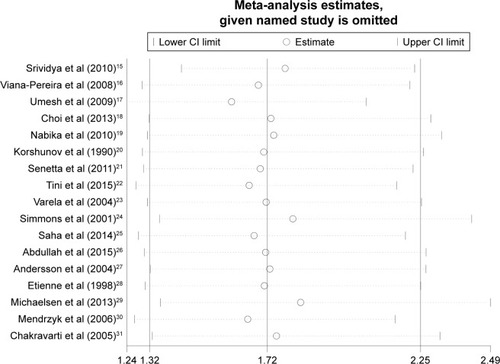
Figure 5 Sensitivity analysis of the relationship between EGFR expression and overall survival in GBM patients.
Abbreviations: CI, confidence interval; EGFR, epidermal growth factor receptor; GBM, glioblastoma multiforme.
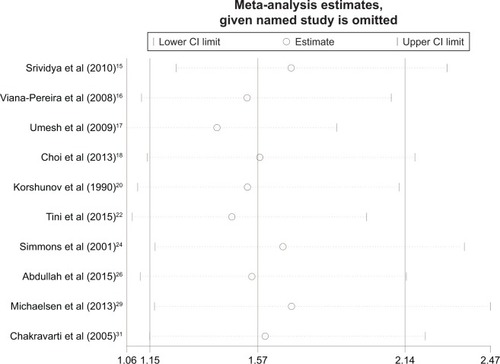
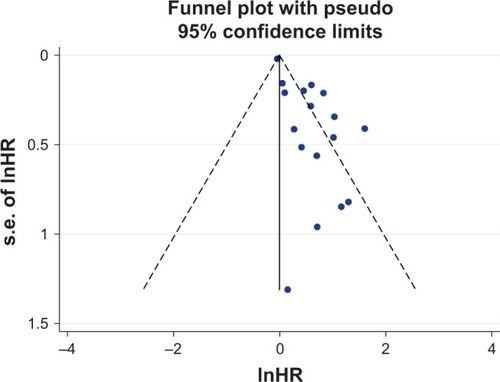
Figure 6 The funnel plot for all the included studies for overall survival.
Abbreviations: s.e., standard error; InHR, natural logarithm hazard ratio.