Figures & data
Table 1 Primer sequence
Figure 1 The HepG2 cells were transfected with Egr-1 siRNA.
Notes: (A1) and (A2) show the cells which were observed under phase contrast microscope at 10 and 24 h, respectively, 200×; (B1) and (B2) show the cells which were observed under fluorescence microscope at 10 and 24 h, respectively, 200×. The transfected cells emitted green fluorescence.
Abbreviation: Egr-1, early growth response protein 1.
Abbreviation: Egr-1, early growth response protein 1.
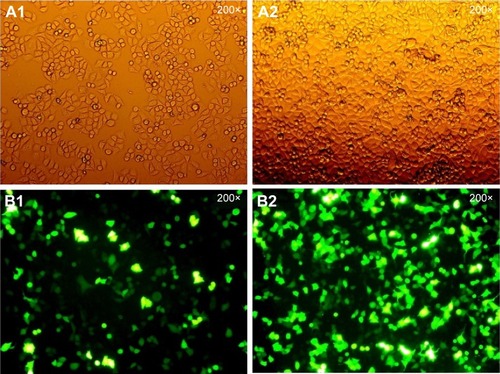
Figure 2 qPCR method to detect transfection efficiency.
Abbreviations: Egr-1, early growth response protein 1; qPCR, real-time quantitative polymerase chain reaction; RQ, relative quantity.
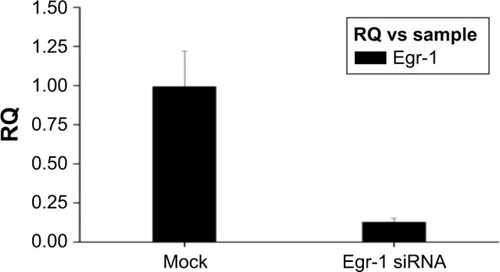
Table 2 Cell proliferation rate after transfection
Figure 3 Effect of As2O3 combined with AZT on cell proliferation inhibition.
Notes: (A) AZT = 10 μmol/L; (B) AZT = 20 μmol/L. aCompared with transfection before, *P<0.05; bcompared with mock, #P>0.05; ccompared with As2O3 or AZT alone of the same group, **P<0.01, #P>0.05.
Abbreviations: As2O3, arsenic trioxide; AZT, 3′-azido-3′-deoxythymidine; Egr-1, early growth response protein 1; NC, negative control.
Abbreviations: As2O3, arsenic trioxide; AZT, 3′-azido-3′-deoxythymidine; Egr-1, early growth response protein 1; NC, negative control.
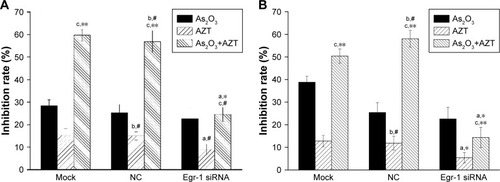
Table 3 CI value of combination of As2O3 and AZT in the three groups of cells (72 h)
Figure 4 Effects of As2O3 combined with AZT on cell apoptosis.
Notes:
aCompared with blank control group, *P<0.05, **P<0.01; bcompared with HepG2 or HepG2/NC, **P<0.01.
Abbreviations: As2O3, arsenic trioxide; AV FITC-A, Annexin V fluorescein isothiocyanate-area; AZT, 3′-azido-3′-deoxythymidine; Egr-1, early growth response protein 1; LL, lower left; LR, lower right; NC, negative control; PE-A, phycoerythrin-area under the curve; PI, propidium iodide; UL, upper left; UR, upper right.
Abbreviations: As2O3, arsenic trioxide; AV FITC-A, Annexin V fluorescein isothiocyanate-area; AZT, 3′-azido-3′-deoxythymidine; Egr-1, early growth response protein 1; LL, lower left; LR, lower right; NC, negative control; PE-A, phycoerythrin-area under the curve; PI, propidium iodide; UL, upper left; UR, upper right.
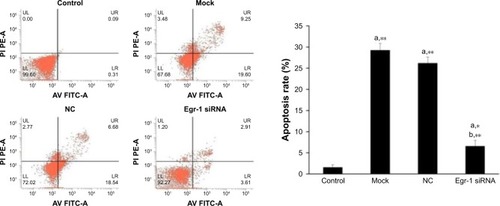
Figure 5 Relative expression of Egr-1 mRNA in HepG2 cells.
Notes: (A) Compared with mock or HepG2/NC group, **P<0.01. (B) aCompared with blank control group, **P<0.01.
Abbreviations: Egr-1, early growth response protein 1; NC, negative control.
Abbreviations: Egr-1, early growth response protein 1; NC, negative control.
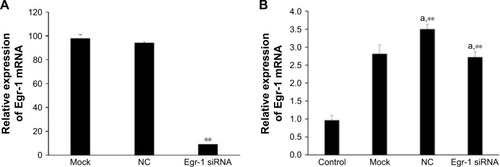
Figure 6 The expression levels of Egr-1 protein in HepG2 cells (n=3).
Note: Compared with control, **P<0.01.
Abbreviations: Egr-1, early growth response protein 1; NC, negative control.
Abbreviations: Egr-1, early growth response protein 1; NC, negative control.
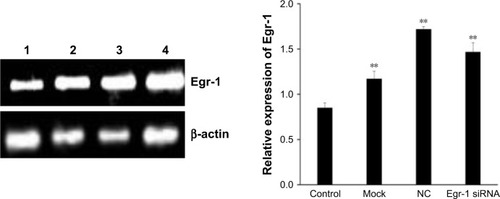
Figure 7 The effect of Egr-1 on expression of p53 and caspase-3 mRNA in HepG2 cells.
Notes: Mock, adding the same amount of culture medium; NC, transfection of nonspecific sequence; Egr-1 siRNA, transfected with Egr-1 siRNA; compared with mock group or NC group, **P<0.01.
Abbreviations: Egr-1, early growth response protein 1; NC, negative control.
Abbreviations: Egr-1, early growth response protein 1; NC, negative control.
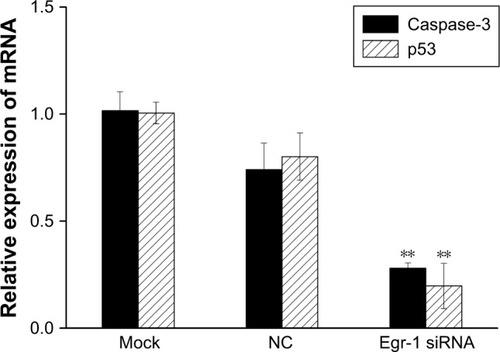
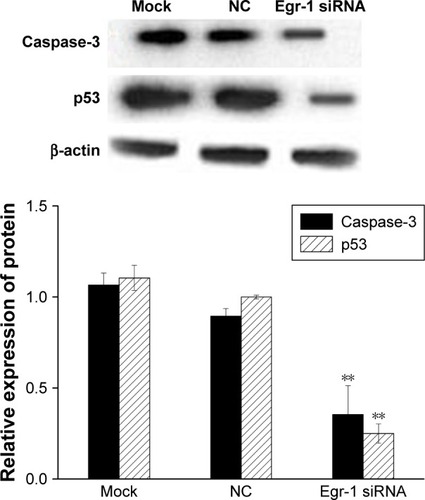
Figure 8 The effect of Egr-1 on expression of p53 and caspase-3 protein in HepG2 cells.
Notes: Mock, adding the same amount of culture medium; NC, transfection of nonspecific sequence, Egr-1 siRNA, transfected with Egr-1 siRNA; compared with mock group or NC group, **P<0.01.
Abbreviations: Egr-1, early growth response protein 1; NC, negative control.
Abbreviations: Egr-1, early growth response protein 1; NC, negative control.