
Figures & data
Figure 1 Flowchart of the study selection process.
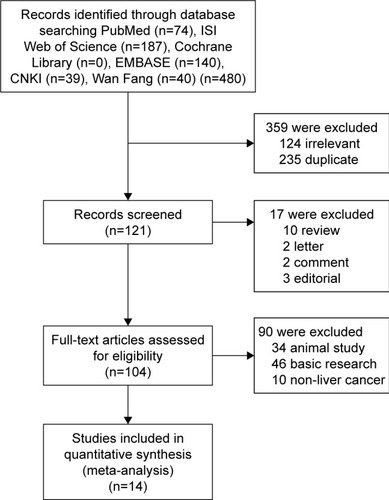
Table 1 FoxM1 clinicopathological features for HCC
Figure 2 Forest plot and funnel plots of the studies evaluating the relationship between FoxM1 expression and clinicopathological features.
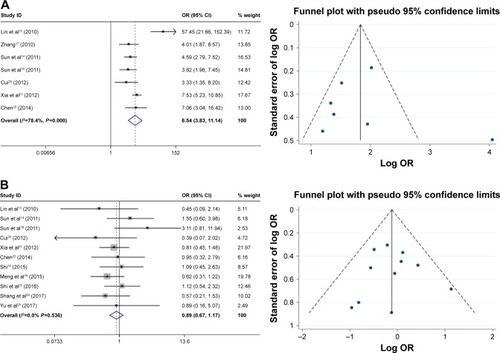
Figure 3 Forest plot and funnel plots of studies evaluating the relationship between FoxM1 expression and clinicopathological features.
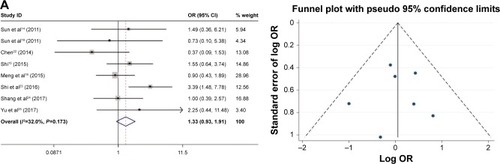
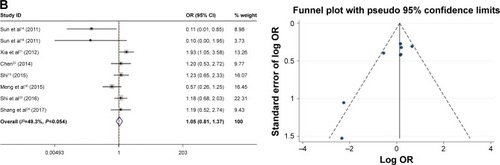
Figure 4 Forest plot and funnel plots of studies evaluating the relationship between FoxM1 expression and clinicopathological features.
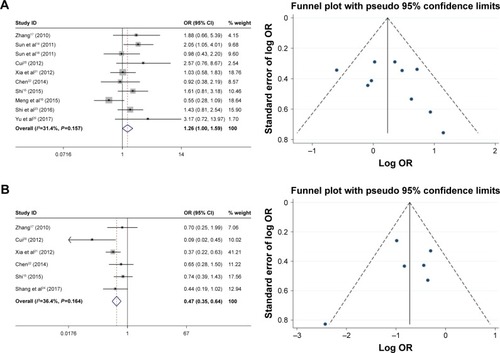
Figure 5 Forest plot and funnel plots of studies evaluating the relationship between FoxM1 expression and clinicopathological features.
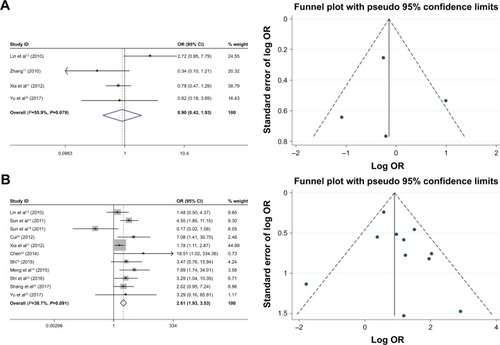
Figure 6 Forest plot and funnel plots of studies evaluating the relationship between FoxM1 expression and clinicopathological features.
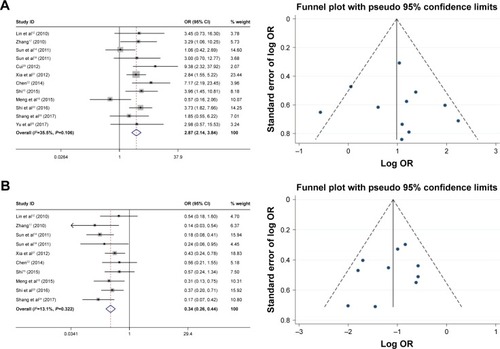
Figure 7 Forest plot and funnel plots of studies evaluating the relationship between FOXM1 expression and prognosis.
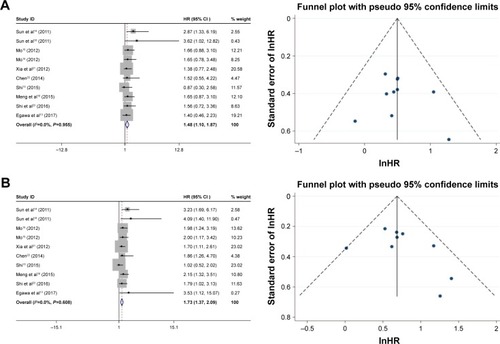
Figure 8 Forest plot and funnel plots of studies evaluating the relationship between FoxM1 expression and prognosis.
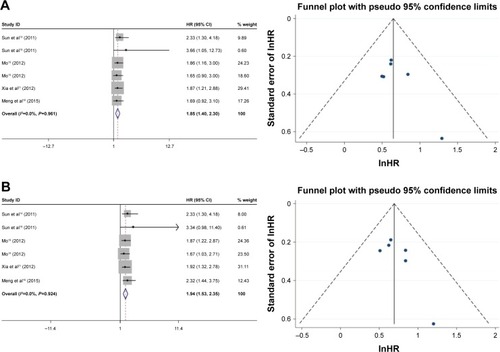
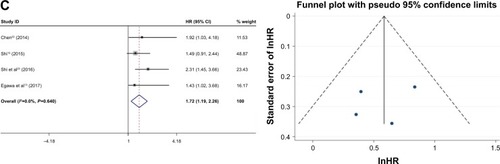
Table 2 Characteristics of studies included in the meta-analysis