Figures & data
Table 1 Summary of baseline patient characteristics
Figure 1 Baseline somatic gene aberrances identified by NGS.
Notes: (A) Mutation oncoprint identified at baseline of the 53 biopsies. Different colors show different types of baseline mutation. The top bar indicates the number of mutations identified in each individual patient; the side bar represents the number of patients having a certain mutation. Bottom categories with different colors indicate histologic subtypes, past TKI treatment history, and gender. (B) The schematic diagram demonstrates oncogenic driver mutations identified in our cohort. The outer ring displays the treatment history. The number in the outer ring indicates the number of patients who received corresponding past treatment.
Abbreviations: chemo, chemotherapy; CN_amp, copy number amplification; LUAD, lung adenocarcinoma; LUSC, lung squamous cell carcinoma; Mut, mutation; NA, not available; NGS, next-generation sequencing; TKI, tyrosine kinase inhibitor.
Abbreviations: chemo, chemotherapy; CN_amp, copy number amplification; LUAD, lung adenocarcinoma; LUSC, lung squamous cell carcinoma; Mut, mutation; NA, not available; NGS, next-generation sequencing; TKI, tyrosine kinase inhibitor.
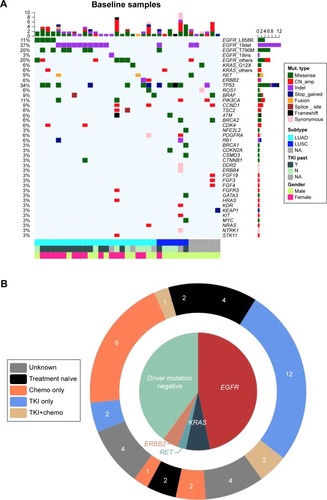
Figure 2 IGV screenshots displaying the reads of each mutation subtype identified by NGS.
Notes: (A) EGFR exon 19 insertion K745_E746insIPVAIK. (B) EGFR double-site mutation H835L+L833V located in cis. (C) PCM1–RET fusion. (D) KIF5B–RET fusion. (E) ADD3-RET fusion.
Abbreviations: IGV, Integrative Genomics Viewer; NGS, next-generation sequencing.
Abbreviations: IGV, Integrative Genomics Viewer; NGS, next-generation sequencing.
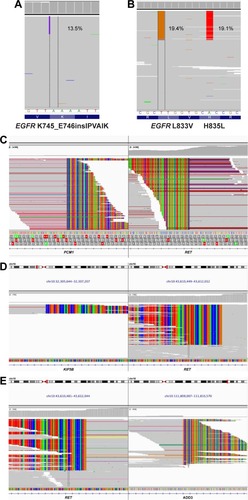
Figure 3 Correlation of patient baseline characteristics, baseline somatic aberrances, and PFS.
Notes: (A) The correlation of EGFR mutation occurrence frequency and smoking status. (B) Patients who received MTT commonly achieved longer PFS. (C) Allelic fraction of EGFR T790M was inversely correlated with PFS. Difference of EGFR mutation percentage between subgroups (never smoker vs smoker) was calculated with Student’s t-test; a two-sided p-value of <0.05 was considered statistically significant. A Kaplan–Meier analysis was used to estimate survival, and a log-rank test was used to determine the difference in survival curve between subgroups.
Abbreviations: AF, allelic fraction; MTT, matched targeted therapy; PFS, progression-free survival.
Abbreviations: AF, allelic fraction; MTT, matched targeted therapy; PFS, progression-free survival.
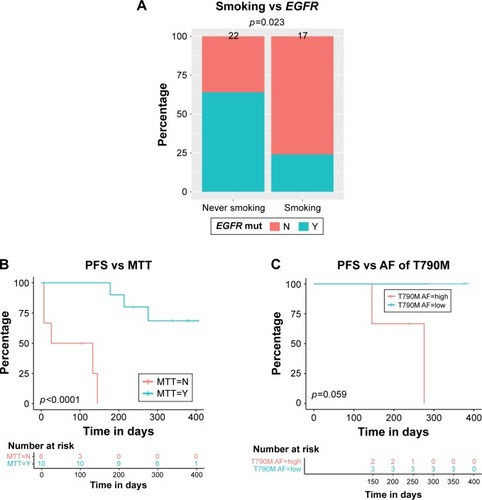
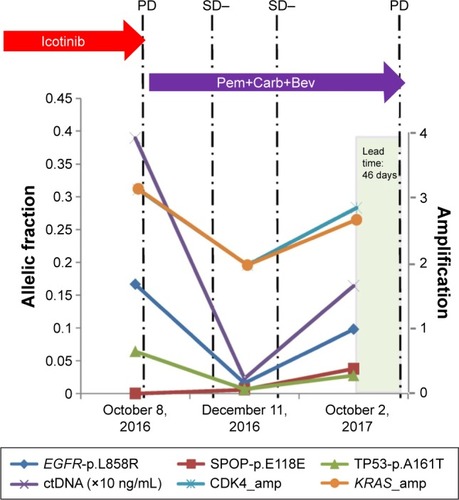
Figure 4 A lung squamous cell carcinoma patient is presented here to illustrate the value of ctDNA in predicting disease progression earlier than radiographic imaging.
Notes: With the development of EGFR L858R and KRAS amplification, which leads to icotinib resistance, he was treated with Pem+Carb+Bev therapy and achieved clinical SD. Afterwards, sequencing of liquid biopsy revealed the increased allelic fraction of EGFR L858R, KRAS amplification, and ctDNA level, which were earlier than clinical PD detected by radiographic imaging for a period of 46 days. This case demonstrated the value of ctDNA for early detection of disease progression than radiological PD.
Abbreviations: amp, amplification; ctDNA, circulating tumor DNA; PD, progressive disease; Pem+Carb+Bev, pemetrexed+carboplatin+bevacizumab; SD, stable disease.
Abbreviations: amp, amplification; ctDNA, circulating tumor DNA; PD, progressive disease; Pem+Carb+Bev, pemetrexed+carboplatin+bevacizumab; SD, stable disease.