Figures & data
Table 1 The amplification primers for the COX-2 gene and GAPDH internal reference
Figure 1 COX-2 mRNA relative expression in lung adenocarcinoma was related to the clinical stage. *P<0.01 or #P<0.01 or &P<0.01 when compared with COX-2 mRNA relative expression in the other three groups.
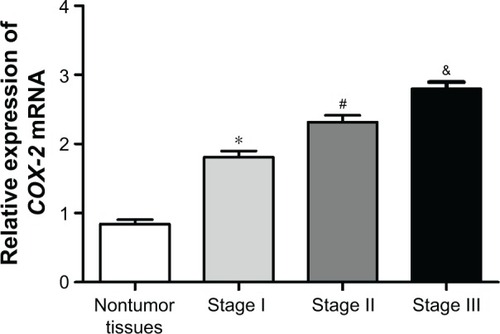
Figure 2 MTT assay was performed to detect the effect of resveratrol on A549 cell proliferation. *P<0.01 when compared with other groups at the same time.
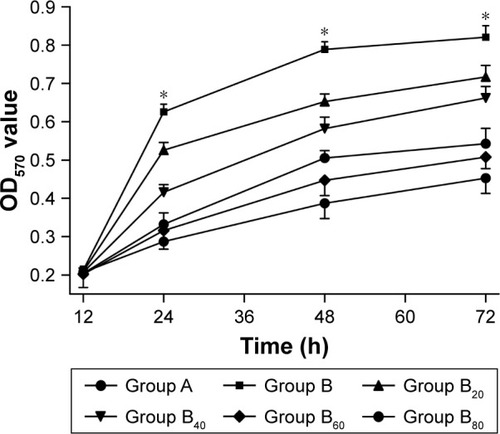
Figure 3 Effects of resveratrol on malignant proliferation of A549 cells. (A) soft agar clone; (B) colony formation rate. *P<0.01 when compared with the other two groups.
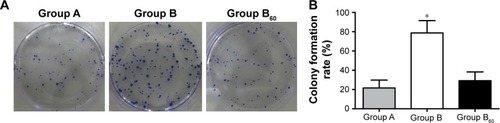
Figure 4 Effects of resveratrol on cell cycle of A549 cells. (A) Flow cytometry was performed to determine cell cycle. (B) Ratio of S phase A549 cell. *P<0.01 when compared with the other two groups.
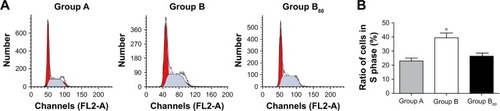
Figure 5 Effects of resveratrol on the expression of COX-2 in A549 cells. (A) Expression of COX-2 mRNA by qRT-PCR. (B) Expression of COX-2 protein by Western blot. *P<0.01 when compared with the other two groups.
Abbreviations: GAPDH, glyceraldehyde 3-phosphate dehydrogenase; qRT-PCR, quantitative reverse transcription polymerase chain reaction.
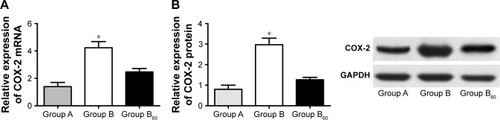
Figure 6 Silencing of COX-2 gene inhibits COX-2 protein expression. (A) Blotting of protein by Western blot. (B) Statistical data of protein by Western blot. *P<0.01 when compared with the other two groups.
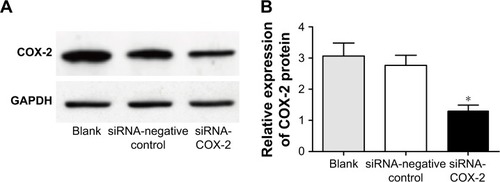
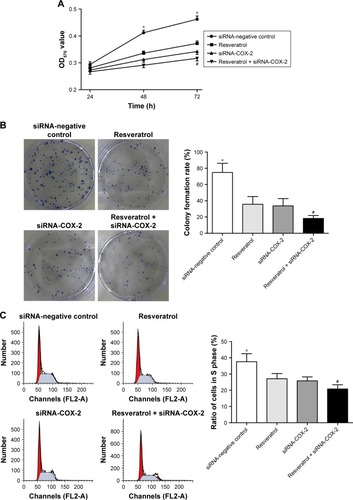
Figure 7 Resveratrol inhibits the proliferation of A549 cells by inhibiting COX-2 expression. (A) Proliferation of A549 cells in each group. (B) Colony formation rate of each group. (C) Ratio of S phase A549 cell in each group. *P<0.01 when compared with the other three groups; #P<0.05 when compared with Resveratrol group and siRNA-COX-2 group.