Figures & data
Table 1 Expression of miR-1269 in samples from patients with lung cancer and its relationship with clinical pathological parameters
Figure 1 miR-1269 was highly expressed in lung cancer tissues. 52 lung cancer tissues and their adjacent normal tissues were collected. (A) The expression level of miR-1269 in lung cancer tissue and normal tissues based on The Cancer Genome Atlas (TCGA) dataset. (B and C) The mRNA expression level of miR-1269 was detected by RT-PCR. U6 was detected as the control of sample loading. Data are expressed as the mean ± SD for three independent experiments. ***P<0.0001.
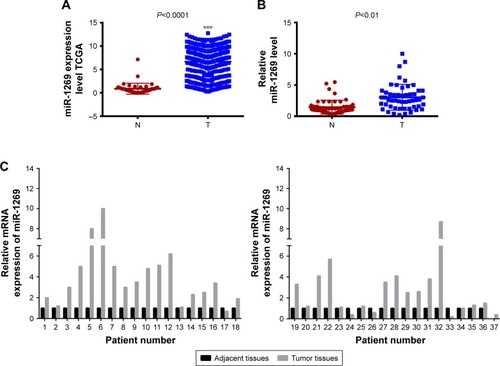
Figure 2 Up-regulation of miR-1269 promoted the growth and inhibited the apoptosis in A549 cells. (A) RT-PCR was used for determining the miR-1269 expressions after A549 cell transfection with miR-1269 mimics. (B) Cell Counting Kit-8 (CCK8) was used for determining cell viability after A549 cell transfection with miR-1269 mimics. (C and D) Colony formation assay was used for determining cell proliferation ability. (E and F) Flow cytometry analysis showed cell apoptosis after A549 cell transfection with miR-1269 mimics; U6 was detected as the control of sample loading. Data are expressed as the mean ± SD for three independent experiments. **P<0.01 versus control group.
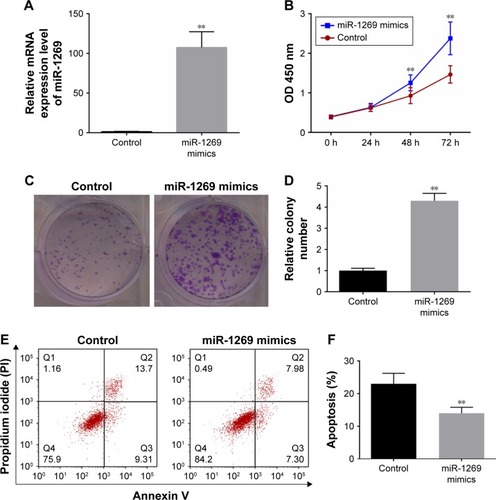
Figure 3 Down-regulation of miR-1269 inhibited the growth and promoted the apoptosis in A549 cells. (A) RT-PCR was used for determining the miR-1269 expressions after A549 cell transfection with miR-1269 inhibitors. (B) Cell Counting Kit-8 (CCK8) was used for determining cell viability after A549 cell transfection with miR-1269 inhibitors. (C and D) Colony formation assay was used for determining cell proliferation ability. (E and F) Flow cytometry analysis showed cell apoptosis after A549 cell transfection with miR-1269 inhibitors; U6 was detected as the control of sample loading. Data are expressed as the mean ± SD for three independent experiments. **P<0.01 versus control group.
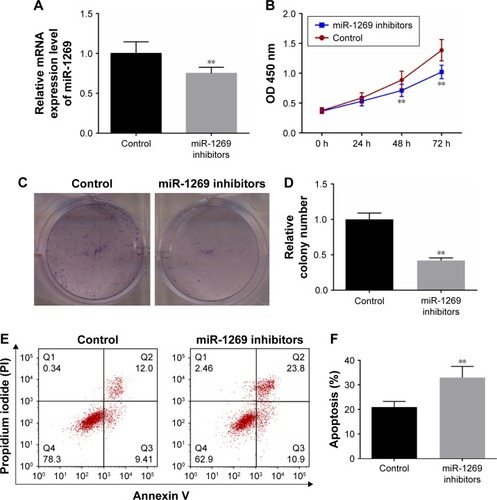
Figure 4 miR-1269 regulated tumor protein p53 (TP53) and caspase-9 expressions and caspase-3 activity. (A) Putative targets predicted by TargetScan. (B) Relative luciferase activity resulted from binding of TP53 3′-untranslated region (UTR) reporter and miR-1269 in A549 cell 48 h after transfection. (C) Putative targets predicted by TargetScan. (D) Relative luciferase activity resulted from binding of caspase-9 3′-UTR reporter and miR-1269 in A549 cell 48 h after transfection. (E) RT-PCR was used for detecting TP53 and caspase-9 expressions after A549 cell transfection with miR-1269 mimics. (F and G) Western blot was used for detecting TP53 and caspase-9 expressions after A549 cell transfection with miR-1269 mimics. (H) Caspase-3 activity detection assay was used for detecting caspase-3 activity in miR-1269 mimics group. (I) RT-PCR was used for detecting TP53 and caspase-9 expressions after A549 cell transfection with miR-1269 inhibitors. (J and K) Western blot was used for detecting TP53 and caspase-9 expressions after A549 cell transfection with miR-1269 inhibitors. (L) Caspase-3 activity detection assay was used for detecting caspase-3 activity in miR-1269 inhibitors. Tubulin was detected as the control of sample loading. Data are expressed as the mean ± SD for three independent experiments. *P<0.05 and **P<0.01 versus control+TP53/or control group.
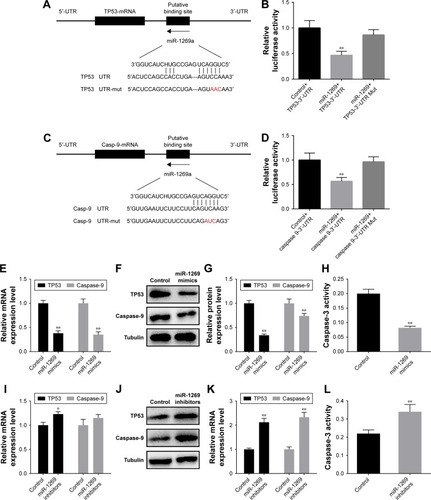
Figure 5 TP53/or caspase-9 silencing regulated the viability and apoptosis in A459 cells. (A) RT-PCR was used for determining TP53 expressions after A459 cell transfection with TP53-siRNA. (B) Western blot was used for determining TP53 expressions after A459 cell transfection with TP53-siRNA. (C) CCK8 was used for determining cell viability after A459 cell transfection with TP53-siRNA. (D and E) Flow cytometry analysis showed cell apoptosis after A549 cell transfection with TP53-siRNA. (F) RT-PCR was used for determining caspase-9 expressions after A459 cell transfection with caspase-9-siRNA. (G) Western blot was used for determining caspase-9 expressions after A459 cell transfection with caspase-9-siRNA. (H) CCK8 was used for determining cell viability after A459 cell transfection with caspase-9-siRNA. (I and J) Flow cytometry analysis showed cell apoptosis after A549 cell transfection with caspase-9-siRNA. Tubulin was detected as the control of sample loading. Data are expressed as the mean ± SD for three independent experiments. **P<0.01 versus siNC group.
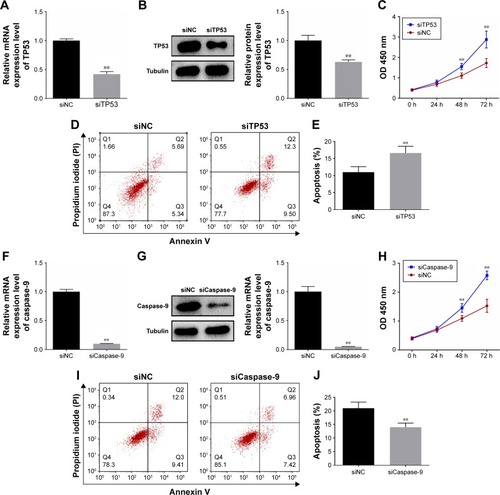
Figure 6 miR-1269 promoted cell survival and proliferation by targeting TP53 and caspase 9 in A549 cells. (A) CCK8 was used for determining cell viability after A459 cell transfection with miR-1269 inhibitors/or caspase-9-siRNA. (B and D) Flow cytometry analysis showed cell apoptosis after A549 cell transfection with miR-1269 inhibitors/or caspase-9-siRNA. (C and E) Flow cytometry analysis showed cell apoptosis after incubation with Z-VAD-FMK in cell transfection with miR-1269 inhibitors. Data are expressed as the mean ± SD for three independent experiments. **P<0.01 versus control+siNC/DMSO group; ##P<0.01 versus miR-1269 inhibitors group.
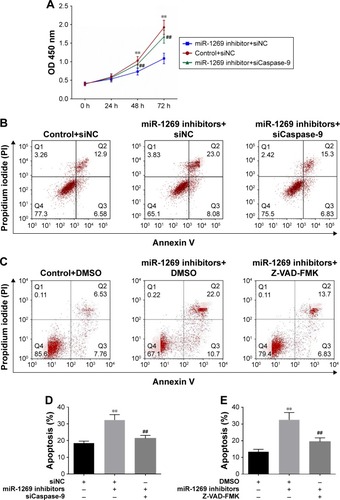
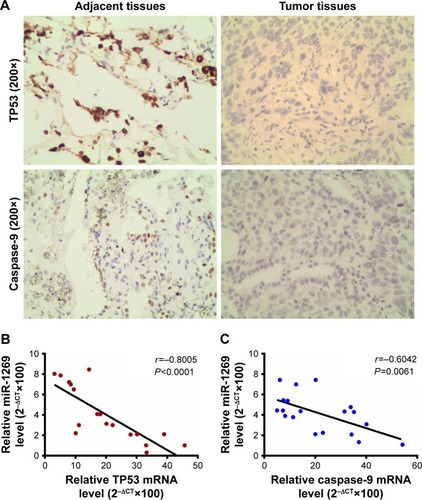
Figure 7 Tumor protein p53 (TP53) and caspase-9 expressions were associated with lung cancer/or miR-1269 expressions. (A) Immunohistochemical staining showed that TP53 and caspase-9 were strongly positively expressed in normal adjacent tissues of lung cancer. (B) The relative analysis showed the negative correlation between miR-1269 and TP53 in mRNA expression level. (C) The relative analysis showed the negative correlation between miR-1269 and caspase-9 in mRNA expression level. Data are expressed as the mean ± SD for three independent experiments.