Figures & data
Table 1 Characteristics of the five studies included in the meta-analysis
Figure 1 Flowchart of the literature selection process.
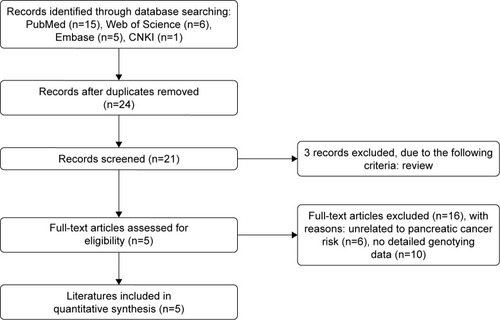
Table 2 Meta-analysis results of association between NR5A2 polymorphism and pancreatic cancer risk
Figure 2 Forest plots of pancreatic cancer risk associated with NR5A2 rs3790843 G>A polymorphism.
Abbreviation: OR, odds ratio.
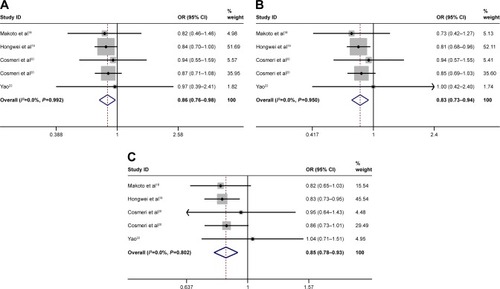
Figure 3 Forest plots of pancreatic cancer risk associated with NR5A2 rs3790844 T>C polymorphism.
Abbreviation: OR, odds ratio.
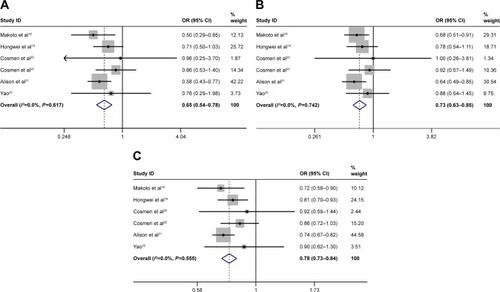
Figure 4 Forest plots of pancreatic cancer risk associated with NR5A2 rs12029406 C>T polymorphism.
Abbreviation: OR, odds ratio.
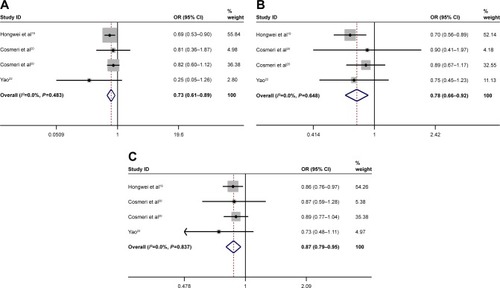
Figure 5 Subgroup analysis of ethnicity for NR5A2 rs3790843 G>A polymorphism and pancreatic cancer risk.
Abbreviation: OR, odds ratio.
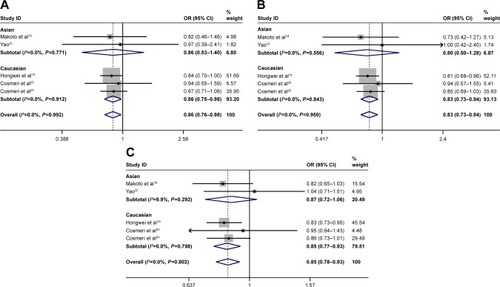
Figure 6 Subgroup analysis of ethnicity for NR5A2 rs3790844 T>C polymorphism and pancreatic cancer risk.
Abbreviation: OR, odds ratio.
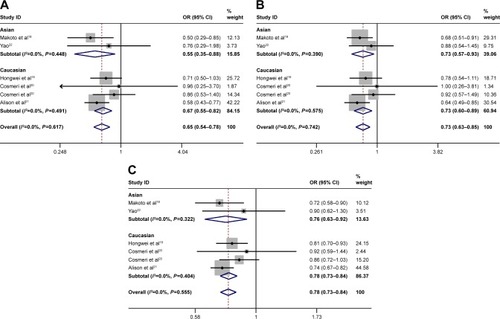
Table 3 The results of Begg’s and Egger’s tests
Figure S1 Subgroup analysis of type of control source for NR5A2 rs3790843 G>A polymorphism and pancreatic cancer risk.
Abbreviations: HB, hospital-based; OR, odds ratio; PB, population-based.
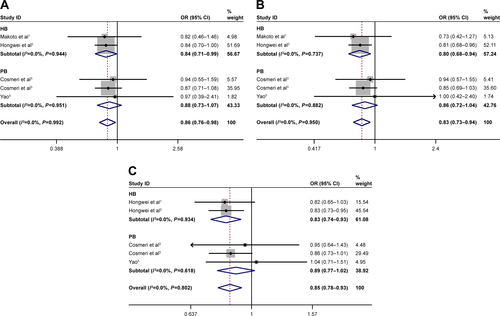
Figure S2 Subgroup analysis of type of control source for NR5A2 rs3790844 T>C polymorphism and pancreatic cancer risk.
Abbreviations: HB, hospital-based; OR, odds ratio; PB, population-based.
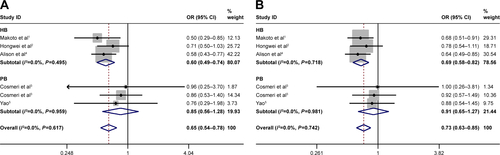
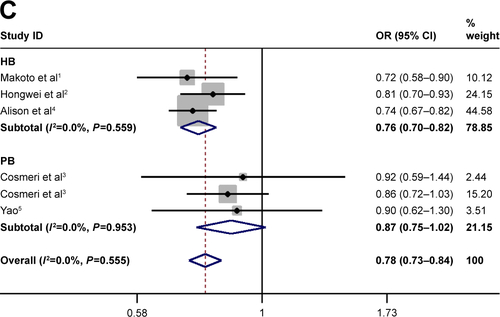
Figure S3 Subgroup analysis of sample size for NR5A2 rs3790843 G>A polymorphism and pancreatic cancer risk.
Abbreviation: OR, odds ratio.
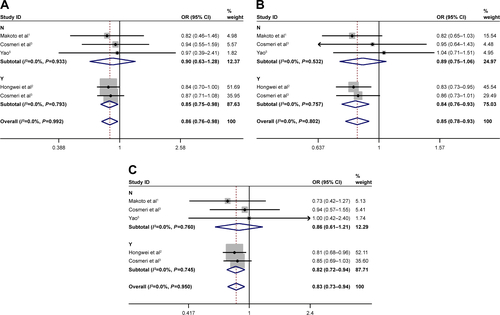
Figure S4 Subgroup analysis of sample size for NR5A2 rs3790844 T>C polymorphism and pancreatic cancer risk.
Abbreviation: OR, odds ratio.
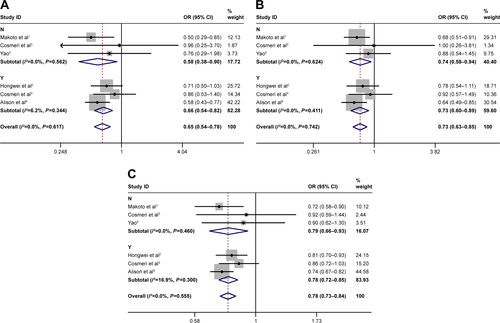
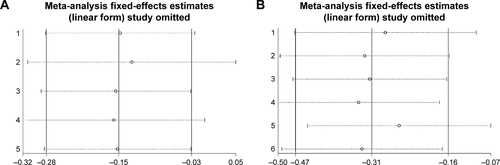
Figure S5 The sensitivity analysis of pancreatic cancer risk associated with NR5A2 polymorphism.