
Figures & data
Figure 1 EZH2 polymorphism affects transcription of downstream targets.
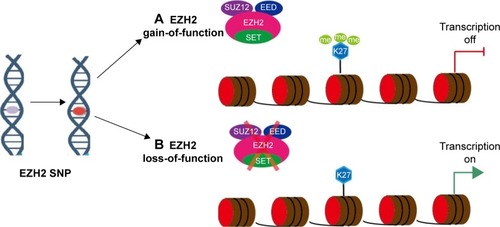
Table 1 Characteristics of studies included in the meta-analysis
Figure 2 Studies identified with criteria of inclusion and exclusion.
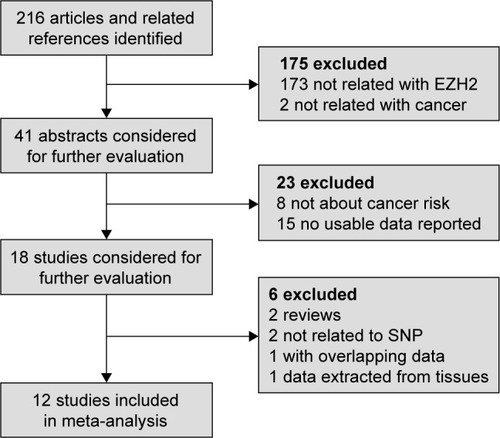
Table 2 Analysis of associations between SNPs of EZH2 and cancer risk
Figure 3 Forest plot for the relationship between rs887569 and cancer risk: (A) CT/CC; (B) TT/CC; (C) CTTT/CC; (D) TT/CCCT.
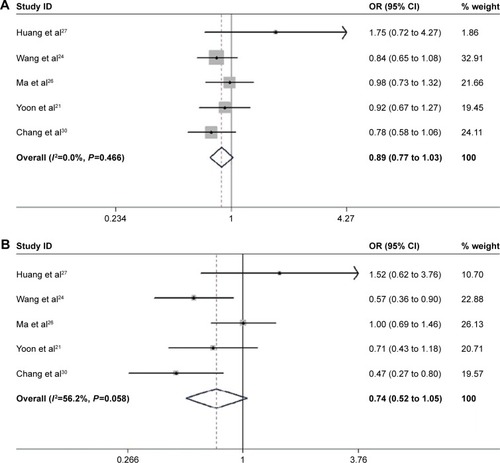
Figure 4 Forest plot for the relationship between rs2302427 and cancer risk: (A) CG/CC; (B) GG/CC; (C) CGGG/CC; (D) GG/CCCG.
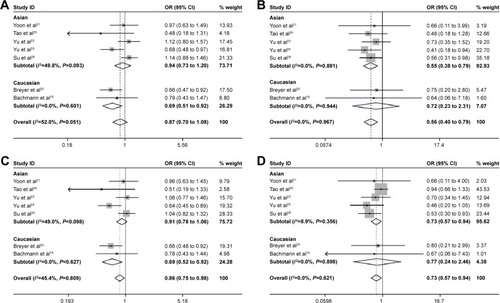
Table 3 Publication bias in meta-analysis for each inheritance model
Figure S1 Forest plot for the relationship between rs3757441 and cancer risk: (A) CT/TT; (B) CC/TT; (C) CCCT/TT; (D) CC/CTTT.
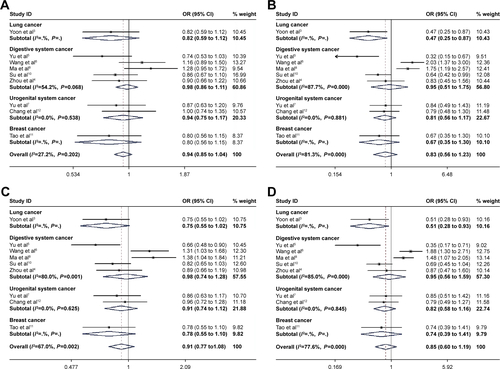
Figure S2 Forest plot for the relationship between rs41277434 and cancer risk: (A) AC/AA; (B) CC/AA; (C) ACCC/AA; (D) CC/AAAC.
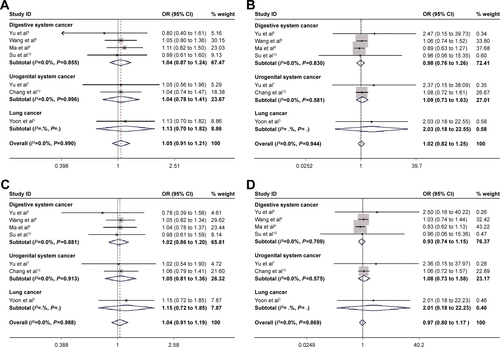
Figure S3 Forest plot of sensitivity analysis for EZH2 SNPs.
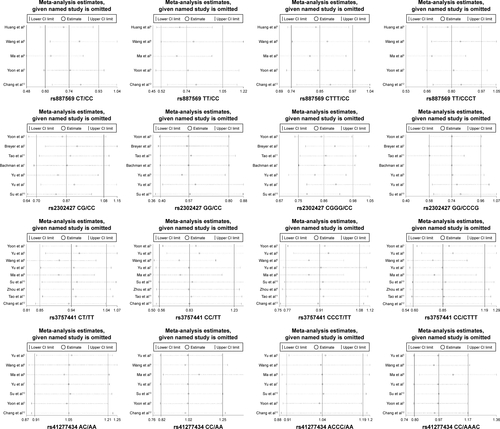
Table S1 Characteristics of eligible studies for each SNP in the meta-analysis