
Figures & data
Table 1 Clinicopathological characteristics of 539 CRC patients
Figure 1 Flowchart of the lncRNA–miRNA–mRNA ceRNA network analysis.
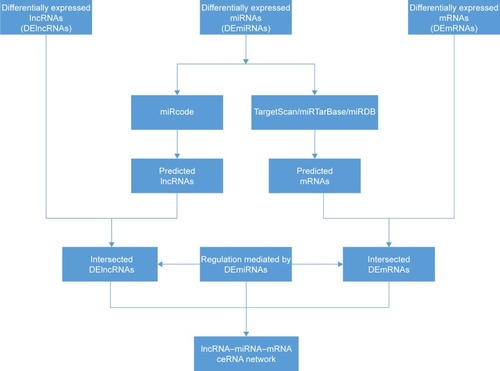
Figure 2 Heatmaps based on the differentially expressed RNAs in CRC and normal tissues.
Abbreviation: CRC, colorectal cancer.
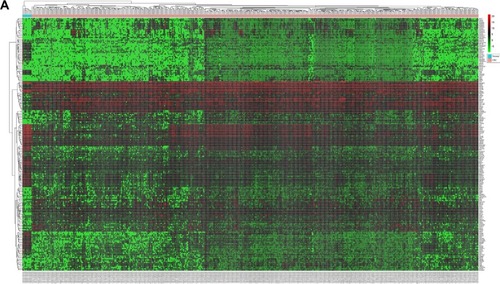
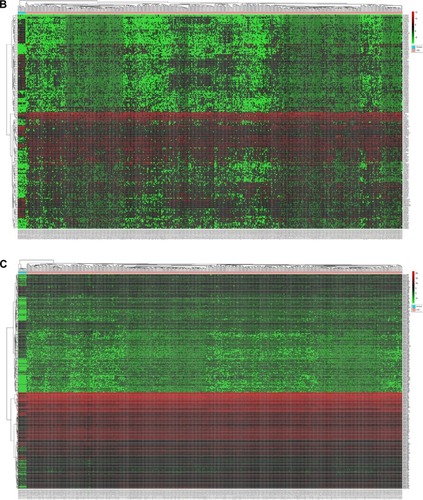
Table 2 The top 11 DElncRNAs putatively targeted by most DEmiRNAs in the ceRNA network
Table 3 The 25 DEmiRNAs with their target DEmRNAs in the ceRNA network
Figure 3 The lncRNA–miRNA–mRNA ceRNA network in CRC.
Abbreviation: CRC, colorectal cancer.
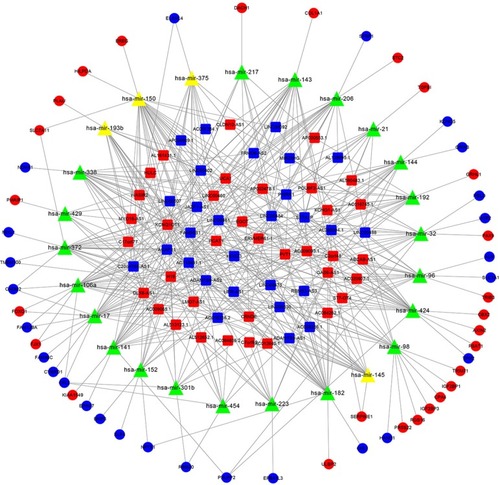
Figure 4 Linear regression of ceRNA expression levels for LINC00461.
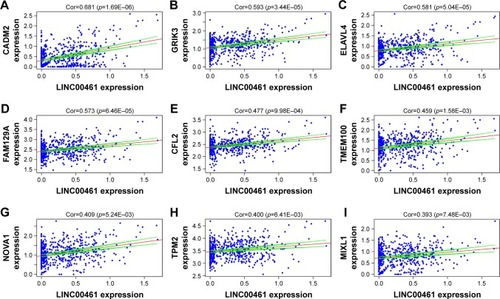
Figure 5 Linear regression of ceRNA expression levels for LINC00484.
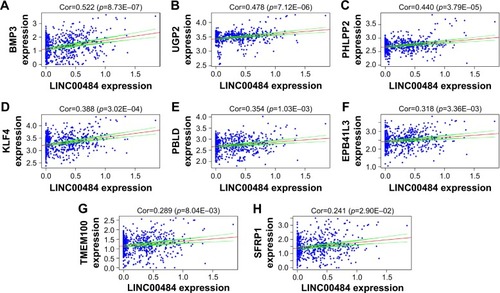
Figure 6 Kaplan–Meier survival curves for the two DElncRNAs significantly associated with overall survival of CRC patients. Note: Kaplan–Meier survival curves for (A) AP004609.1 and (B) C2orf48.
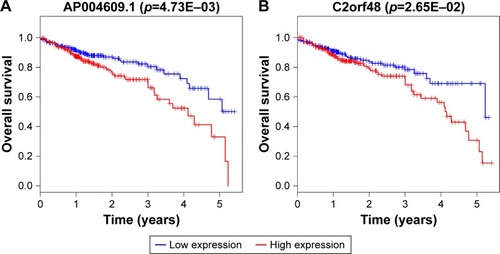
Figure 7 Kaplan–Meier survival curves for the five DEmiRNAs significantly associated with overall survival of CRC patients.
Abbreviation: CRC, colorectal cancer.
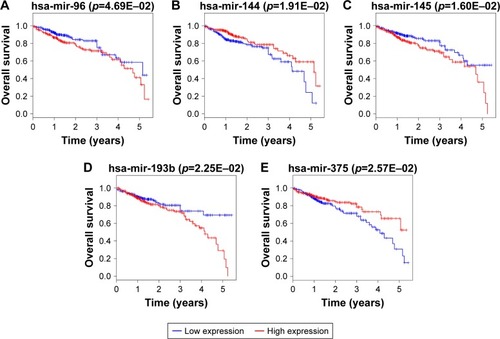
Figure 8 Kaplan–Meier survival curves for the six DEmRNAs significantly associated with overall survival of CRC patients.
Abbreviation: CRC, colorectal cancer.
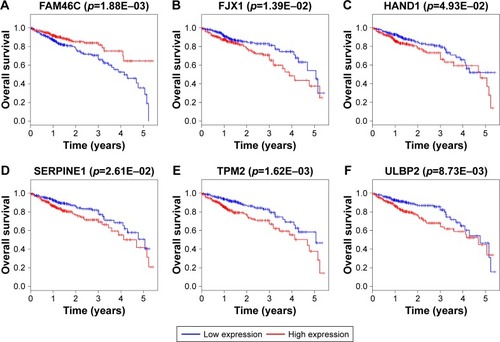
Table 4 The correlations between DElncRNAs from the ceRNA network and clinical features of CRC patients
Table 5 The top 10 predominant BP terms and all the four CC terms and MF terms in GO functional enrichment analysis
Table 6 KEGG pathways enriched by the DEmRNAs in the ceRNA network
Table S1 All the 64 DElncRNAs in the ceRNA network