Figures & data
Figure 1 Aerobic glycolysis is involved in regulating hepatoma cell proliferation by miR-342-3p.
Notes: (A, B) The proliferation curve of HepG2 and MHCC97H hepatoma cells transfected with miR-342-3p mimics or non-specific control for miRNA mimics (NC) and treated with 2.5 mM 2-DG as indicated. qRT-PCR analyzation suggests miR-342-3p expression level. (C, D) Colony formation assays of HepG2 and MHCC97H cells treated and analyzed as in (A and B). *P <0.01.
Abbreviation: NC, negative control.
Abbreviation: NC, negative control.
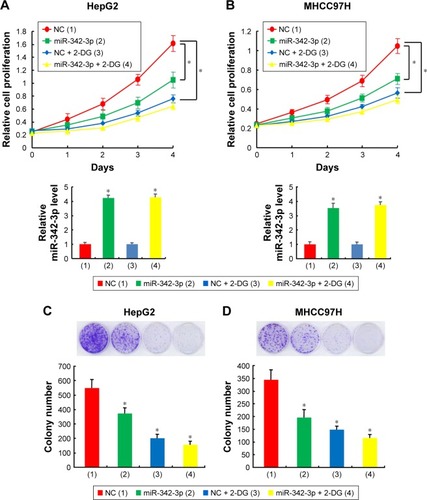
Figure 2 IGF-1R is a direct target of miR-342-3p.
Notes: (A, B) Immunoblot analysis of HepG2 and MHCC97H cells transfected with NC or miR-342-3p mimics, or scramble or miR-342-3p inhibitor. Scramble was the negative control for miRNA inhibitors. Histograms under the immunoblot graphs indicate corresponding miRNAs expression levels by qRT-PCR. β-actin was used as a loading control for immunoblot. (C, D) qRT-PCR analysis of IGF-1R mRNA expression levels in the indicated hepatoma cell lines transfected with miR-342-3p mimics or miR-342-3p inhibitor. (E) miRNA luciferase reporter assays of HepG2 and MHCC97H cells transfected with miR-342-3p mimics plus wild-type or mutated IGF-1R reporter. The top panel shows wild-type and mutant forms of putative miR-342-3p target sequences of IGF-1R 3′-UTR. Red font indicates the supposed miR-342-3p binding sites within human IGF-1R 3′-UTR. Red and italicized font indicates the mutations fetched in the IGF-1R 3′-UTR. *P <0.01.
Abbreviations: NC, negative control; 3′-UTR, 3′-untranslated region.
Abbreviations: NC, negative control; 3′-UTR, 3′-untranslated region.
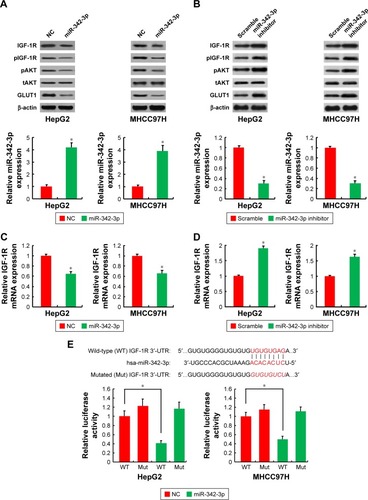
Figure 3 miR-342-3p suppresses hepatoma cell proliferation and glycolysis mainly through inhibition of IGF-1R expression.
Notes: (A) HepG2 cells transfected with NC or miR-342-3p mimics plus IGF-1R siRNA or not. The proliferation of the cells was determined by CCK-8 assay. The typical immunoblot indicates IGF-1R expression. Histograms indicate miR-342-3p expression level determined by qRT-PCR. (B) Colony formation assay of HepG2 cells were transfected as in (A). Typical images show colonies in 35 mm plates (upper panels). Histograms show colony number. (C–E) HepG2 cells were transfected as mentioned above, glucose uptake, the production of lactate and ATP, ECAR, and OCR were then determined. Representative immunoblot reveals the expression of IGF-1R. qRT-PCR analysis shows miR-342-3p expression. *P <0.05, **P <0.01.
Abbreviations: NC, negative control; CCK-8, cell counting kit-8; ECAR, extracellular acidification rate; OCR, oxygen consumption rate; FCCP, p-trifluoromethoxy carbonyl cyanide phenylhydrrazone; Rote/AA, rotenone plus the mitochondrial complex III inhibitor antimycin A.
Abbreviations: NC, negative control; CCK-8, cell counting kit-8; ECAR, extracellular acidification rate; OCR, oxygen consumption rate; FCCP, p-trifluoromethoxy carbonyl cyanide phenylhydrrazone; Rote/AA, rotenone plus the mitochondrial complex III inhibitor antimycin A.
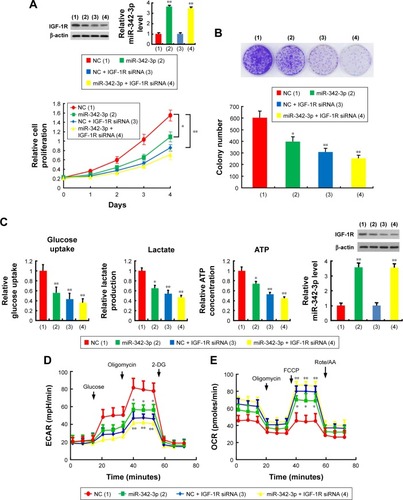
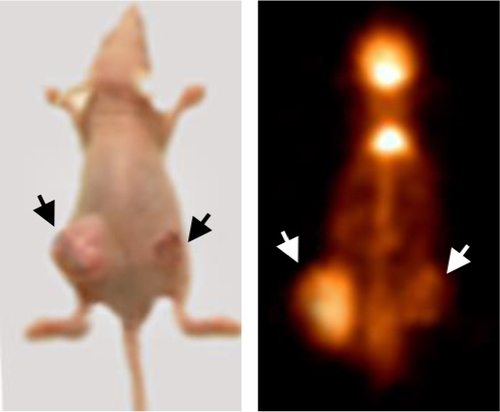
Figure 4 miR-342-3p/IGF1R axis regulates glycolysis and tumor growth in vivo.
Notes: (A) Representative FDG microPET images of living nude mice injected with pCDH or pCDH-miR-342 stably expressing HepG2 cells as indicated. Arrows indicate the tumor glucose uptake. Scatter diagram showed the radioactivity of each ablated tumors. (B) Lactate level of representative tumor tissues from (A). (C) Representative immunoblot and qRT-PCR analysis of the expression of the indicated proteins and miR-342 in representative excised tumor from (A). The indicated tumor tissue from a single mouse in each group was cut into several pieces and then used for immunoblot and qRT-PCR. *P <0.01.
Abbreviations: FDG microPET, fluorodeoxyglucose micropositron emission tomography; T/M, tumor to muscle; NC, negative control.
Abbreviations: FDG microPET, fluorodeoxyglucose micropositron emission tomography; T/M, tumor to muscle; NC, negative control.
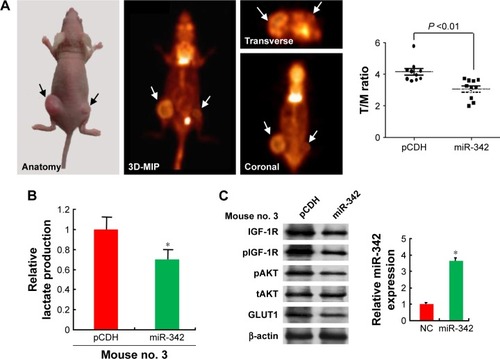
Figure S1 Screening for the target of miR-342-3 in HEK293T cells.
Notes: Immunoblot analysis of HEK293T cells transfected with NC or miR-342-3p mimics. β-actin used as a loading control.
Abbreviation: NC, negative control.
Abbreviation: NC, negative control.
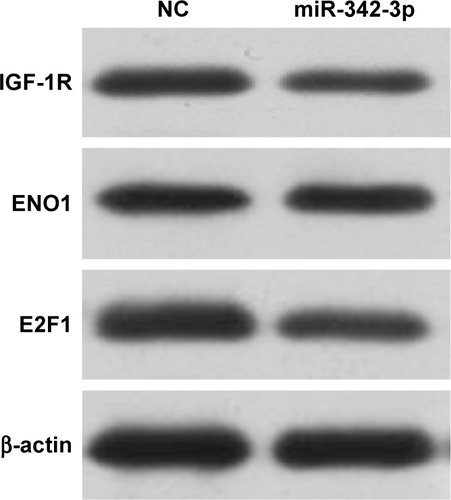
Figure S2 miR-342-3p suppresses proliferation, glucose uptake and the production of lactate and ATP through inhibition of IGF-1R expression in HCC cells.
Notes: (A) HepG2 cells were transfected with miR-342-3p mimics or miR-342-3p mimics plus IGF-1R expression vector. The proliferation of the cells was detected by CCK-8 assay. The representative immunoblot shows IGF-1R expression. Histograms show miR-342-3p expression determined by qRT-PCR. β-actin was used as a loading control. (B) HepG2 cells were transfected as in (A), glucose uptake and the production of lactate and ATP were determined. *P<0.05; **P<0.01.
Abbreviations: NC, negative control; CCK-8, cell counting kit-8.
Abbreviations: NC, negative control; CCK-8, cell counting kit-8.
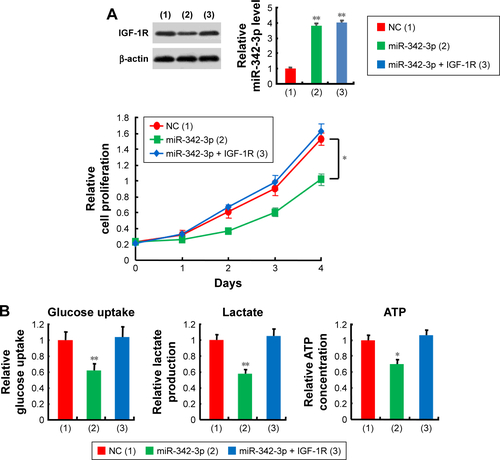
Figure S3 miR-342-3p/IGF-1R axis regulates glycolysis and tumor growth in vivo.
Notes: Representative FDG microPET images of living nude mice injected with pCDH or pCDH-miR-342 stably expressing HepG2 cells as indicated. Arrows indicate the tumor glucose uptake.
Abbreviation: FDG microPET, fluorodeoxyglucose micropositron emission tomography.
Abbreviation: FDG microPET, fluorodeoxyglucose micropositron emission tomography.