
Figures & data
Table 1 The proportions of patients with low and high Romo1 expression according to clinicopathologic parameters
Figure 1 Representative IHC-stained tissue samples. Magnification, ×100; (A) Romo1, negative control, IHC score of 2, 10, and 15; (B) VEGF-C, negative control, IHC score of 2, 9, and 15; (C) VEGF-D, negative control, IHC score of 2, 8, and 15; (D) ROS, negative control, IHC score of 1, 7, and 15.
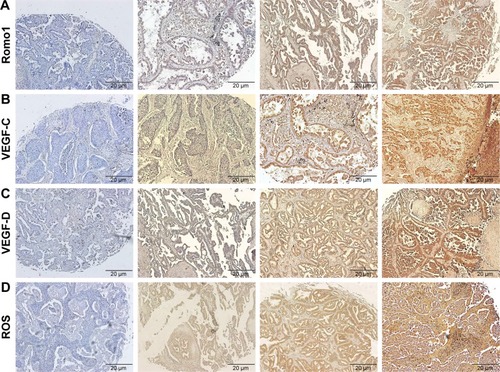
Figure 2 ROC analysis to set best cutoff for Romo1 and serologic inflammatory biomarkers (NLR, PLR, and CRP–albumin ratio).
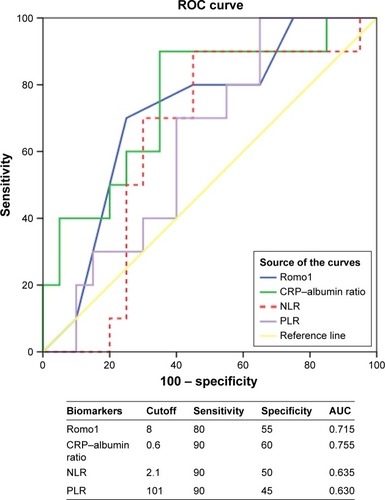
Figure 3 Kaplan–Meier curves of disease-free survival according to Romo1 (A), NLR (B), PLR (C), and CRP–albumin ratio (D).
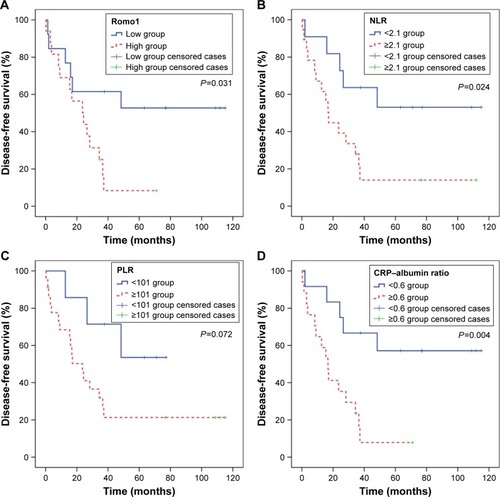
Figure 4 Kaplan–Meier curves of overall survival according to Romo1 (A), NLR (B), PLR (C), and CRP–albumin ratio (D).
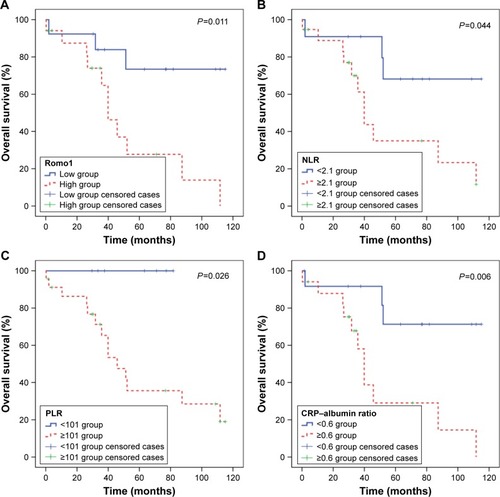
Figure 5 Kaplan-Meier curves of overall survival according to the number of inflammatory risk factors (A). Analyses using Bonferroni corrected P values (Pc) showed that overall survival was significantly shorter in group C compared with group B (B) or group A (C). Number of risk factors: group A =0; group B =1 or 2; group C =3.
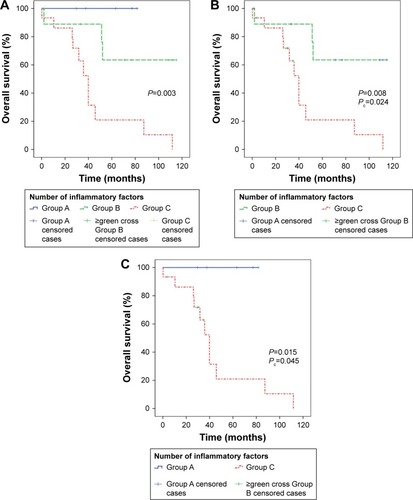
Figure 6 Spearman’s correlation analyses evaluating correlation among Romo1, VEGF-C, VEGF-D, and ROS; Romo1 expression levels showed significant positive correlation with VEGF-C (P=0.008, R=0.478) (A) and ROS (P=0.016, R=0.436) (C) in tumor samples. (B) There was no significant correlation between Romo1 expression and VEGF-D levels.
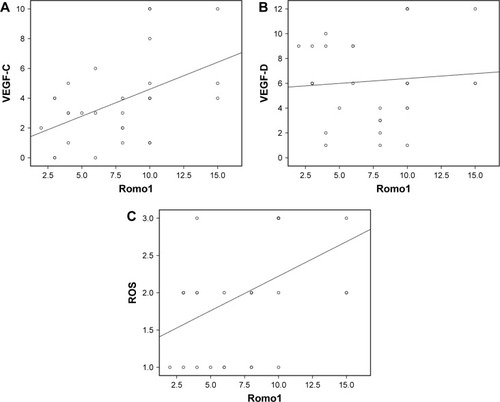
Table S1 Association between Romo1 and clinicopathologic parameters
Table S2 Survival analyses for patients