Figures & data
Figure 1 TBMS1 induced proliferation inhibition and morphological change in OSCC cells.
Notes: (A) Chemical structure of TBMS1. (B) Cell viability was explored by MTT assay at 0, 1, 3, 5 and 7 days. (C and D) Cell numbers were counted, and cell morphological change was observed after cells being treated with TBMS1 for 24 and 48 h. Scale bar 100 μm. (E and F) After cells being treated with TBMS1 for 24 and 48 h, images of BrdU-positive cells were captured. Scale bar 50 μm. (G) The percentages of BrdU-positive cells were calculated and statistically analyzed. All data were presented as mean ± SD. *P < 0.05, **P < 0.01, ***P < 0.001, ****P < 0.0001 compared with the control group (0 μM).
Abbreviations: μM, μmol/L; d, days; h, hours; TBMS1, tubeimoside-1; OSCC, oral squamous cell carcinoma; MTT, 3-(4,5-dimethylthiazol-2-yl)-2,5-diphenylte-trazolium bromide; BrdU, 5-bromo-2-deoxyuridine; DAPI, 4′,6-diamidino-2-phenylindole.
Abbreviations: μM, μmol/L; d, days; h, hours; TBMS1, tubeimoside-1; OSCC, oral squamous cell carcinoma; MTT, 3-(4,5-dimethylthiazol-2-yl)-2,5-diphenylte-trazolium bromide; BrdU, 5-bromo-2-deoxyuridine; DAPI, 4′,6-diamidino-2-phenylindole.
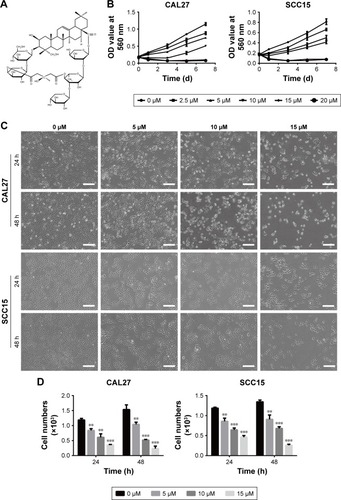
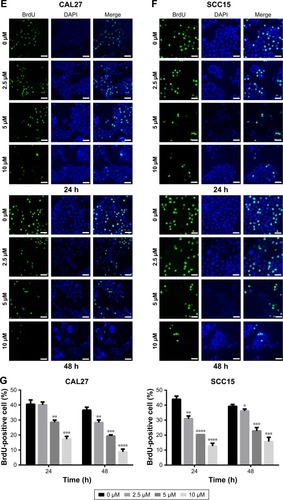
Figure 2 TBMS1 inhibited colony formation ability of OSCC cells in vitro.
Notes: (A) Colonies of CAL27 and SCC15 cells are shown by pictures taken by a scanner after cells being treated with 10 μM TBMS1. (B) Micromorphology of colonies in soft agar was exhibited by photographs through an inverted microscope after cells were treated under the same conditions. Scale bar 100 μm. (C) Colony numbers of cells treated with 0 and 10 μM of TBMS1 were computed. All data were presented as mean ± SD. ***P < 0.001, ****P < 0.0001 compared with the control group (0 μM).
Abbreviations: μM, μmol/L; TBMS1, tubeimoside-1; OSCC, oral squamous cell carcinoma.
Abbreviations: μM, μmol/L; TBMS1, tubeimoside-1; OSCC, oral squamous cell carcinoma.
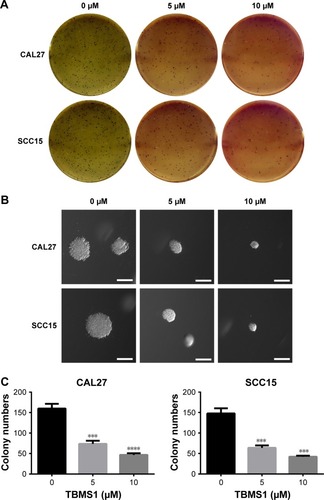
Figure 3 TBMS1 suppressed migration of OSCC cells in vitro.
Notes: (A) Wound healing assay was carried out to detect the effect of TBMS1 on the migration of CAL27 and SCC15 cells. Scale bar 100 μm. (B and C) Transwell assay was also performed after OSCC cells were treated with TBMS1 and the cells that migrated across the membrane were photographed and counted through repeated tests. Scale bar 50 μm. (D) c-Myc and MMP-7 expression was reduced by TBMS1 in OSCC cells at 24 and 48 h, respectively. All data were presented as the mean ± SD. *P < 0.05, **P < 0.01, ****P < 0.0001 compared with the control group (0 μM).
Abbreviations: μM, μmol/L; h, hours; TBMS1, tubeimoside-1; OSCC, oral squamous cell carcinoma.
Abbreviations: μM, μmol/L; h, hours; TBMS1, tubeimoside-1; OSCC, oral squamous cell carcinoma.
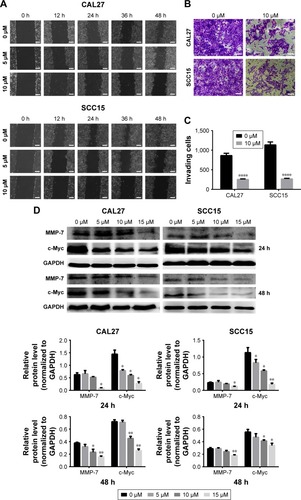
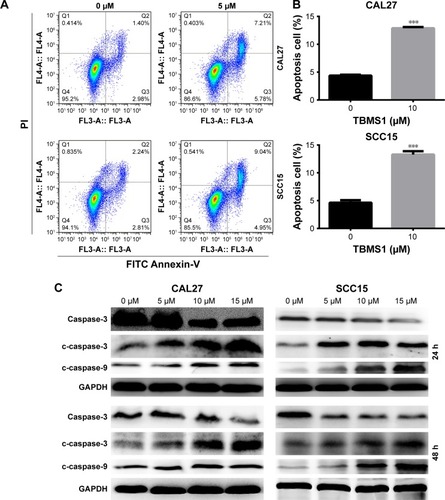
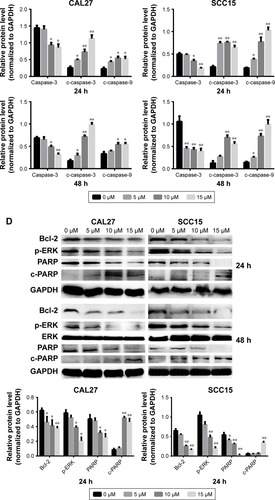
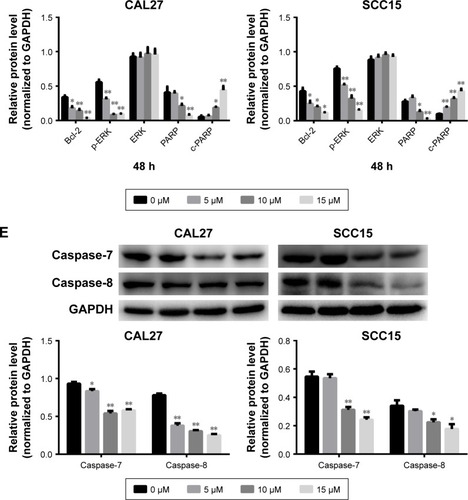
Figure 4 TBMS1 induced apoptosis in OSCC cells.
Notes: (A and B) Flow cytometry was utilized to explore the apoptosis after cells were stained by Annexin V and PI. (C and D) Effect of TBMS1 on the expression of caspase-3, caspase-9 and other intrinsic pathway-related proteins in CAL27 and SCC15 cells was investigated by Western blot assay after cells being treated with TBMS1 for 24 and 48 h. (E) The expression of extrinsic pathway-related proteins caspase-7 and caspase-8 was explored after OSCC cells were treated with TBMS1 for 48 h. All data were presented as mean ± SD. *P < 0.05, **P < 0.01, and ***P < 0.001 compared with the control group (0 μM).
Abbreviations: μM, μmol/L; TBMS1, tubeimoside-1; h, hours; FITC, fluorescein isothiocyanate; PI, propidium iodide; OSCC, oral squamous cell carcinoma.
Abbreviations: μM, μmol/L; TBMS1, tubeimoside-1; h, hours; FITC, fluorescein isothiocyanate; PI, propidium iodide; OSCC, oral squamous cell carcinoma.