Figures & data
Table 1 Association of HDAC9 expression with the clinical features of breast cancer patients
Figure 1 The mRNA expression of HDAC9 measured by qRT-PCR.
Notes: (A) HDAC9 expression in breast cancer tissues and paired normal tissues. The expression of HDAC9 was higher in breast cancer tissues than that in the matched normal tissues (***P<0.001). (B) HDAC9 expression in cells. The expression of HDAC9 was increased in breast cancer cells compared with the normal cells (**P<0.01, ***P<0.001).
Abbreviation: qRT-PCR, quantitative real-time polymerase chain reaction.
Abbreviation: qRT-PCR, quantitative real-time polymerase chain reaction.
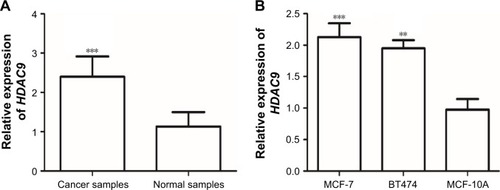
Table 2 Univariate and multivariate Cox analysis for HDAC9 in breast cancer patients
Figure 2 Kaplan–Meier survival curves for breast cancer patients based on the expression of HDAC9.
Notes:
P-value was calculated using the log-rank test. Patients with high HDAC9 expression had shorter survival time than those with low HDAC9 expression (log-rank P<0.05).
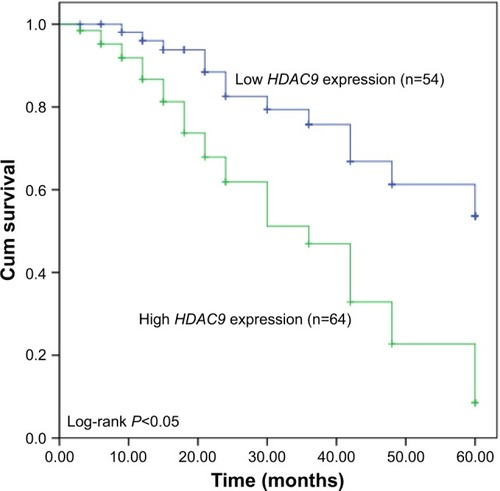
Figure 3 Expression of HDAC9 in cells treated with siRNA or SAHA.
Notes: (A) HDAC9 expression was significantly decreased in MCF-7 transfected with HDAC9 siRNA and MCF-7 treated with SAHA compared with the controls (**P<0.01, ***P<0.001). (B) HDAC9 expression was significantly decreased in BT474 transfected with HDAC9 siRNA and BT474 treated with SAHA compared with the controls (**P<0.01).
Abbreviations: DMSO, dimethyl sulfoxide; SAHA, suberoylanilide hydroxamic acid.
Abbreviations: DMSO, dimethyl sulfoxide; SAHA, suberoylanilide hydroxamic acid.
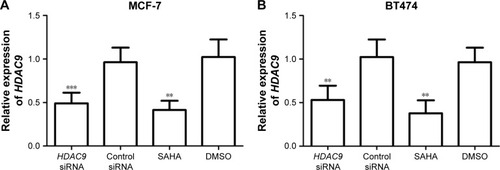
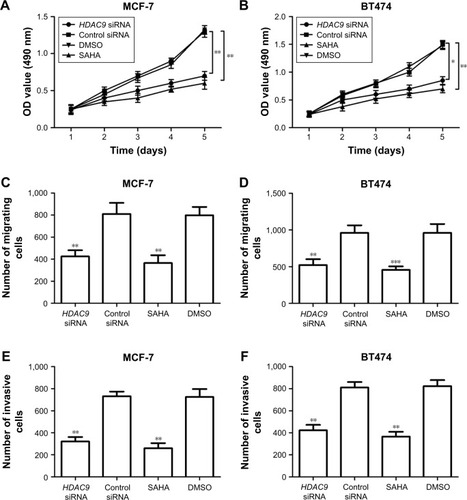
Figure 4 Effects of HDAC9 expression on cell proliferation, migration and invasion of breast cancer cells.
Notes: (A, B) Cell proliferation was suppressed by HDAC9 knockdown in MCF-7 and BT474 cells (*P<0.05, **P<0.01). (C, D) Number of migrated cells was decreased by a reduction of HDAC9 in breast cancer cells (**P<0.01, ***P<0.001). (E, F) Cell invasion was inhibited by the downregulation of HDAC9 in both MCF-7 and BT474 cells (**P<0.01).
Abbreviations: DMSO, dimethyl sulfoxide; SAHA, suberoylanilide hydroxamic acid.
Abbreviations: DMSO, dimethyl sulfoxide; SAHA, suberoylanilide hydroxamic acid.