Figures & data
Figure 1 Upregulation of LINC00888 in melanoma tumor tissues and its clinical significance. (A) Relative expression of LINC00888 in melanoma tumors and the paired adjacent normal tissues were detected by qRT-PCR (n=28; **p<0.01). (B) Kaplan–Meier analysis of the correlation between high and low LINC00888 expression in 28 melanoma patients and 4-year survival (log-rank test; p<0.05).
Table 1 Correlation of LINC00888 expression levels with clinicopathological parameters of patients with melanoma
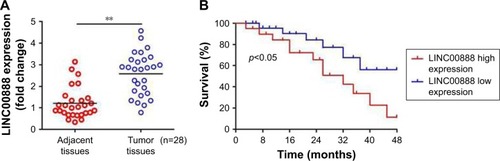
Table 1 Correlation of LINC00888 expression levels with clinicopathological parameters of patients with melanoma
Figure 2 Knockdown of LINC00888 inhibited the cellular proliferation of melanoma. (A) LINC00888 expression in A375-S2 cells was detected by qRT-PCR after treatment with siRNA1, siRNA2, or siRNA3 for 72 hours. *p<0.05, **p<0.01. (B) The cell proliferation of A375-S2 after transfection with LINC00888 siRNAs or negative control for 24, 48, or 72 hours. *p<0.05, **p<0.01. (C) The apoptosis rate of A375-S2 cells with transfection of LINC00888 siRNAs (right panel) or negative control (left panel) was determined by Annexin V/PI staining in 72 hours. (D) The quantitative comparison of Annexin V/PI staining between positive cells and cells transfected with negative control or LIN00888 siRNA2 (n=3, **p<0.01 vs control). (E) Representative invasion assay readout of cells transfected with negative control or LIN00888 siRNA2 for 24 hours. (F) The cells which invaded through the membrane were fixed with paraformaldehyde, stained with crystal violet, and counted under an inverted microscope (normalized to control group, n=3, **p<0.01 vs control). (G) Protein expression of E-cadherin and vimentin in A375-S2 cells after transfection with LINC00888 siRNAs or negative control for 72 hours. (H) The quantification of E-cadherin and vimentin proteins expressions in the cells (n=3, *p<0.05, **p<0.01 vs control).
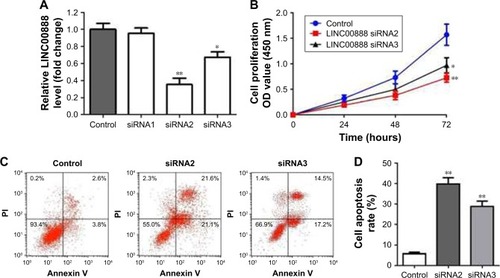
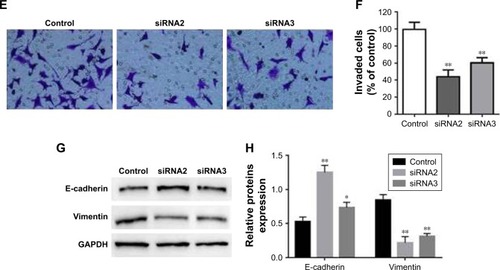
Figure 3 Overexpression of LINC00888 enhanced the A375-S2 cell proliferation and invasion. (A) Transfection of lenti-LINC00888 effectively overexpressed LINC00888 in the cells, revealed by qRT-PCR (n=3, **p<0.01 vs control). (B) The cell proliferation of cells transfected with lentivirus empty control or lenti-LINC00888 from 0 to 72 hours posttreatment (n=3, **p<0.01 vs control). (C) Representative invasion of cells transfected with negative control or lenti-LIN00888 was taken using a phase-contrast inverted microscope. (D) The quantitative comparison of invaded A375-S2 cells transfected with negative control or lenti-LIN00888 (n=3, **p<0.01 vs control). (E) Protein expression of E-cadherin and vimentin in A375-S2 cells after transfection with negative control or lenti-LIN00888 for 72 hours. (F) The quantification of E-cadherin and vimentin protein expression in the cells (n=3, **p<0.01 vs control). (G) A375-S2 cells were seeded in 6-well plates at 500 or 1,000 cells per well overnight, and then, the cells were treated with control or LINC00888 overexpression particles for 72 hours. And then, the pictures of colony format were taken using a digital camera. (H) The violet crystals were dissolved with 70% ethanol, and absorbance (595 nm) was measured with microplate reader (n=3, *p<0.05, **p<0.01 vs control).
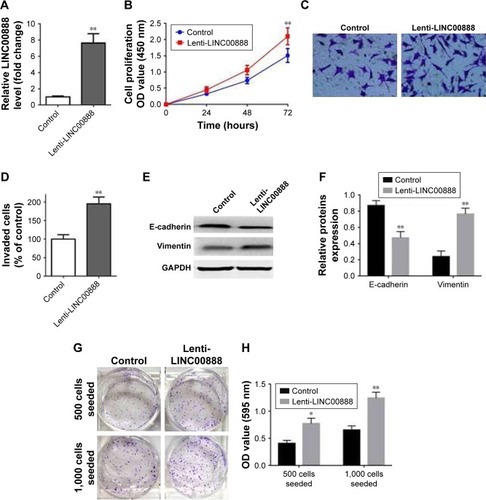
Figure 4 LINC00888 directly suppressed miR-126/CRK axis in A375-S2. (A) The predicted binding sites between LINC00888 and miR-126-5p through complementary base-pairs. The wild-type LINC00888 3′UTR (WT; containing the binding sites of miR-126-5p) or mutant-type LINC00888 3′UTR (MT) vectors were constructed. (B and C) A375-S2 cells were treated with LINC00888 siRNA2 or lenti-LINC00888 for 72 hours, and the expression of miR-126 were detected by qRT-PCR (n=3, **p<0.01 vs control). (D) miR-126 could directly regulate transcriptional level of LINC00888, demonstrated by dual-luciferase reporter assay (n=3, **p<0.01 vs control). (E) The predicted binding sites between targeted gene CRK and miR-126-5p through complementary base-pairs. The wild-type CRK 3′UTR (WT) or mutant-type CRK 3′UTR (MT) vectors containing the binding sites of miR-126-5p were constructed. (F) LINC00888 stable knockdown and control A375-S2 cells were cotransfected with miR-126 inhibitors and luciferase reporters containing CRK 3′UTR, or nothing. Luciferase activities were then detected by dual-luciferase reporter assay (n=3, **p<0.01 vs control). (G) LINC00888 stable overexpression and control A375-S2 cells were cotransfected with miR-126 inhibitors and luciferase reporters containing CRK 3′UTR, or nothing. Luciferase activities were then detected by dual-luciferase reporter assay (n=3, **p<0.01 vs control).
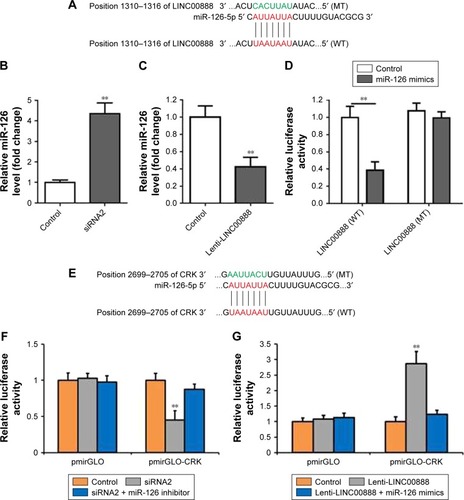
Figure 5 Overexpression of LINC00888 promoted the CRK expression via suppressing miR-126. (A) CRK and GAPDH expressions in cells transfected with negative control, LINC00888 siRNA2, or LINC00888 siRNA2 plus miR-126 inhibitor were measured by Western blot. (B) The quantitation of CRK protein expression in cells transfected with control, LINC00888 siRNA2, or LINC00888 siRNA2 plus miR-126 inhibitor (n=3, **p<0.01 vs control). (C) CRK and GAPDH expression in the cells transfected with control, lenti-LINC00888, or lenti-LINC00888 plus miR-126 mimics were detected by Western blot. (D) The quantitation of CRK protein expression in cells transfected with control, lenti-LINC00888, or lenti-LINC00888 plus miR-126 mimics (n=3, **p<0.01 vs control).
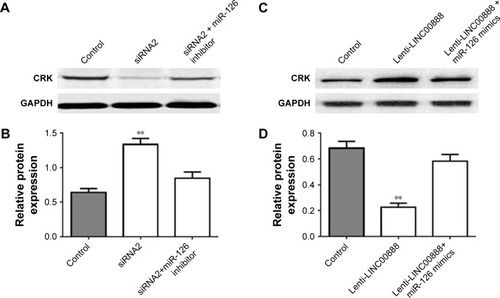
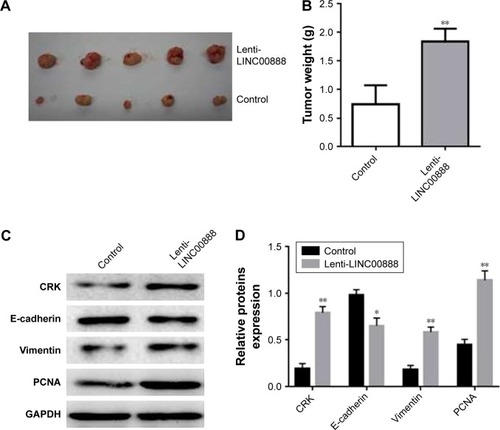
Figure 6 Overexpression of LINC00888 promoted A375-S2 tumor growth via increasing CRK, expression, and EMT in vivo. (A) The comparison of tumor sizes from five nude mice inoculated with LINC00888 stable overexpression or control A375-S2 cells, respectively. (B) Tumor weights of nude mice inoculated with LINC00888 stable overexpression or control A375-S2 cells were recorded in 28 days, respectively (n=5, **p<0.01 vs control). (C) CRK, E-cadherin, vimentin, and PCNA protein expressions in these two groups were detected by Western blot on day 28. (D) The quantification of CRK, E-cadherin, vimentin, and PCNA proteins expressions in tumor tissues (n=3, *p<0.05, **p<0.01 vs control).