Figures & data
Figure 1 Preoperative axillary photo of patient.
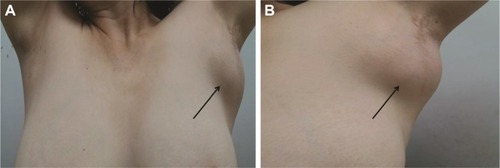
Figure 2 Imaging of ultrasound and MRI examination of breast.
Abbreviation: MRI, magnetic resonance imaging.
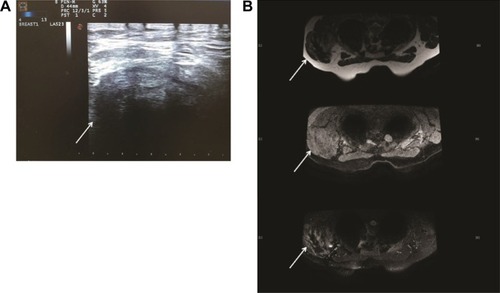
Figure 3 Imaging of 18 F-fluorodeoxyglucose (FDG) PET/CT.
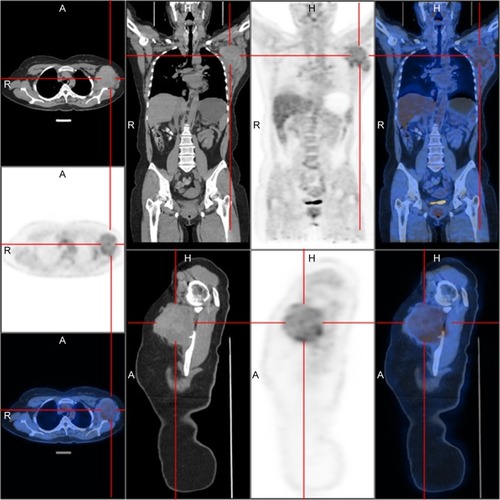
Figure 4 Image of core needle biopsy histologic diagnosis using hematoxylin and eosin staining (scale bar =2,000 μm; original ×100).
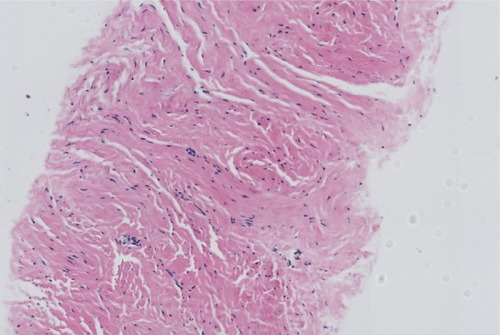
Figure 5 Intraoperative photo of the mass.
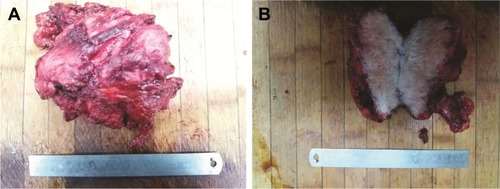
Figure 6 Image of paraffin pathology histologic diagnosis using hematoxylin and eosin staining (scale bar =2,000 μm; original ×100).
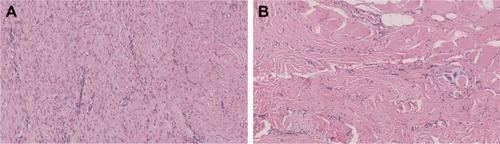
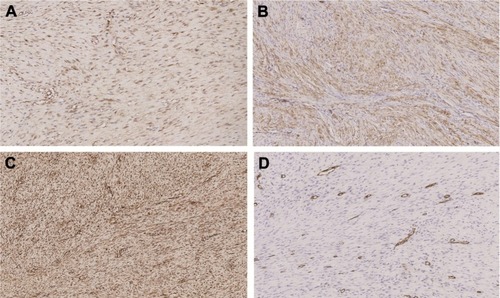
Figure 7 Expression of β-catenin, SMA, vimentin, and CD34 by IHC staining (scale bar =2,000 μm; original × 100).
Notes: (A) β-Catenin positive expression can be detected by IHC staining. (B) SMA positive expression can be detected by IHC staining. (D) CD34 positive expression can be detected by IHC staining.