Figures & data
Figure 1 Limonin inhibited HCC cell proliferation and colony formation.
Notes: (A) Chemical structure of limonin, (B and C) limonin inhibited HCC cell proliferation. Hep3B (B) or HepG2 (C) cells were incubated with various concentrations of limonin for different times, and the cell viability was determined. (D and E) Limonin suppressed HCC cell anchorage-independent growth in soft agar. Hep3B (D) or HepG2 (E) cell suspensions were plated into a 6-well plate and exposed to different limonin concentrations; the anchorage-independent assay was performed. The asterisks (*p<0.05, **p<0.01, ***p<0.001, Student’s t-test) indicate significant difference versus the control.
Abbreviation: HCC, hepatocellular carcinoma.
Abbreviation: HCC, hepatocellular carcinoma.
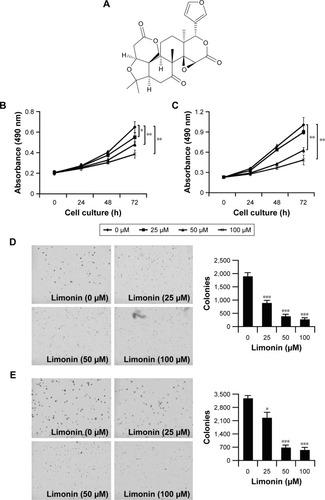
Figure 2 Limonin suppressed tumor glycolysis by decreasing HK-2 activity.
Notes: (A and B) Limonin inhibited tumor glycolysis in HepG2 and Hep3B cells. HepG2 (A) or Hep3B (B) cells were treated with different concentrations of limonin for 24 h; glucose consumption (left), lactate production (middle) and intracellular ATP levels (right) were examined as described. The asterisks (*p<0.05, **p<0.01, ***p<0.001, Student’s t-test) indicate statistical difference versus the control. (C) Limonin had no effects on the expressions of important glycolytic enzymes. After incubation of limonin for 24 h, the expression of given protein was determined by Western blotting. (D) Limonin reduced HK-2 activity dose dependently. After treatment with limonin, the activities of HK-2 were detected as described in “Materials and methods” section. The asterisks (**p<0.01, ***p<0.001, Student’s t-test) indicate significant difference in contrast with the control.
Abbreviation: HK-2, hexokinase-2.
Abbreviation: HK-2, hexokinase-2.
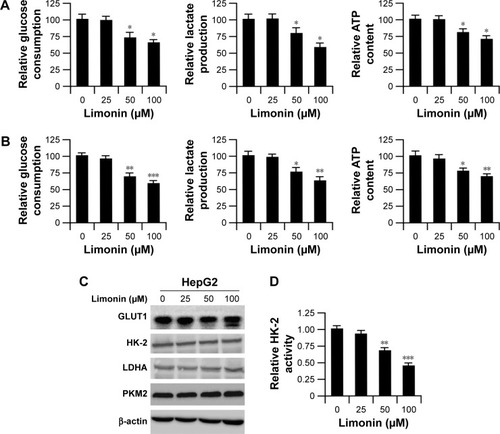
Figure 3 Limonin decreased HK-2 expression in mitochondria.
Notes: (A) HK-2 expression in mitochondria was reduced. After limonin treatment, the cytosolic and mitochondrial fractions were separated, and HK-2 expression was assessed by Western blotting. (B) The interaction between HK-2 and VDAC-1 was decreased. The cell lysates were immunoprecipitated with VDAC-1 antibody and then probed with HK-2 antibody by Western blotting. (C) HK-2 phosphorylation was decreased after limonin treatment. Cell lysates were immunoprecipitated with HK-2 antibody and then detected with PAS antibody to examine HK-2 phosphorylation.
Abbreviations: HK-2, hexokinase-2; VDAC-1, voltage-dependent anion channel 1; PAS, phospho-Akt substrate.
Abbreviations: HK-2, hexokinase-2; VDAC-1, voltage-dependent anion channel 1; PAS, phospho-Akt substrate.
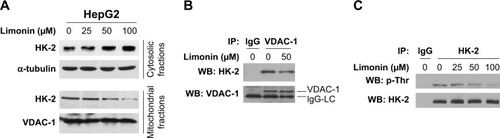
Figure 4 Limonin induced cell apoptosis in HepG2 cells.
Notes: After limonin treatment for 24 h, HepG2 cells were subjected to Annexin V/propidium iodide double staining and FACS analysis (A) or Western blotting with indicated antibodies (B). The asterisks (*p<0.05, Student’s t-test) indicated significant difference versus the control. (C) Limonin increased Bax binding to mitochondria and induced cytochrome C release. After limonin treatment, the cytosolic and mitochondrial fractions were isolated, and the expressions of given proteins were examined with indicated antibodies.
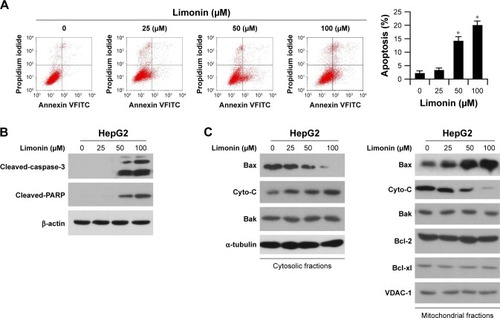
Figure 5 Limonin suppressed Akt activity in HepG2 cells.
Notes: (A) Limonin inhibited Akt activity and its downstream signaling pathway. The cell lysates of HepG2 cells treated with limonin were probed with indicated antibodies. (B) Limonin blocked Akt activity in mitochondria. The mitochondrial fractions were isolated, and Akt phosphorylation was determined. (C) Limonin inhibited Akt-mediated HK-2 phosphorylation. The lysates of the mitochondria fractions were immunoprecipitated with HK-2 antibody and phosphor-Akt was examined.
Abbreviation: HK-2, hexokinase-2.
Abbreviation: HK-2, hexokinase-2.
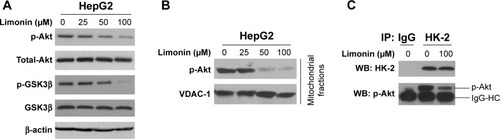
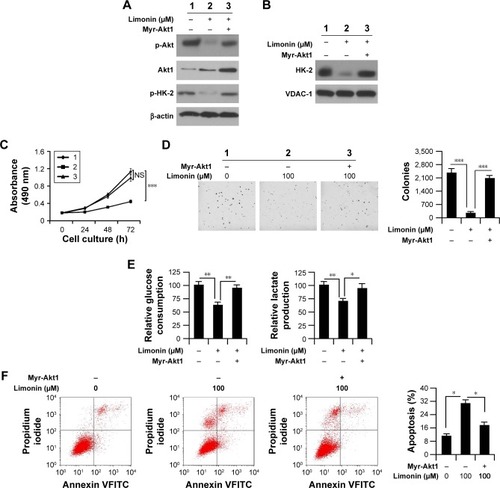
Figure 6 Exogenous hyperactivation of Akt impaired limonin-induced proliferation inhibition, glycolysis suppression and cell apoptosis.
Notes: (A) Phosphor-Akt and HK-2 expression in Myr-Akt-transfected HepG2 cells. HepG2 cells were transfected with Myr-Akt1 and then treated with 100 μM limonin; the expression of given proteins was examined by Western blotting. (B) Myr-Akt1 transfection promoted HK-2 mitochondrial location. After Myr-Akt1 transfection, the lysates of mitochondrial fractions were immunoprecipitated with VDAC-1 antibody and then probed with HK-2. (C and D) The inhibitory effects of limonin in Myr-Akt1-transfected HepG2 cells. After Myr-Akt1 transfection, the effects of limonin on cell proliferation (C) and anchorage-independent growth (D) were determined. 1: untreated; 2: limonin treated; 3: Myr-Akt1 transfected and limonin treated. The asterisks (***p<0.001, Student’s t-test) indicate significant difference between different groups. (E and F) The activities of limonin in glycolysis and apoptosis induction in Akt-hyperactivated HepG2 cells. In Myr-Akt1-transfected HepG2 cells, the effects of limonin on tumor glycolysis (E) and apoptosis induction (F) were evaluated. The asterisks (*p<0.05, **p<0.01, Student’s t-test) indicate significant difference between different groups.
Abbreviations: HK-2, hexokinase-2; VDAC-1, voltage-dependent anion channel 1; NS, no significance.
Abbreviations: HK-2, hexokinase-2; VDAC-1, voltage-dependent anion channel 1; NS, no significance.