Figures & data
Table 1 Primers used in quantitative polymerase chain reaction (qPCR) experiments
Figure 1 Triclosan induced the expression of drug-resistance genes in HCC cells.
Notes: MHCC97-H cells were treated with solvent control, 30, 100, 300 nmol/L, or 1 μmol/L triclosan. Total RNA samples extracted from cell lines were analyzed by qPCR, and β-actin was chosen as a loading control. Results were analyzed by cluster analysis and shown as (A) relative mRNA level (mRNA amount compared to loading control) or (B) relative change of mRNA level (change folds of indicated group compared to solvent control group). Figures are shown as thermal map. The color changes refer the induction of gene expression. Lines in left part of each figures indicate the clusters.
Abbreviations: ABCC1, ATP-binding cassette subfamily C member 1; ABCC2, ATP-binding cassette subfamily C member 2; ABCC3, ATP-binding cassette subfamily C member 3; ABCG2, ATP-binding cassette subfamily G member 2; ADRA2A, adrenoceptor α2A; ALDH1A1, aldehyde dehydrogenase 1 family; Apo E, apolipoprotein E; COMT, catechol-O-methyltransferase; CYP1A2, cytochrome P450 1A2; CYP2C11, cytochrome P450 2C11; CYP2C22, cytochrome P450 2C22; CYP3A1, cytochrome P450 3A1; CYP3A4, cytochrome P450 3A4; CYP3A5, cytochrome P450 3A5; CYP2C19, cytochrome P450 2C19; DPYD, dihydropyrimidine dehydrogenase; HCC, hepatocellular carcinoma; HTR2A, 5-hydroxytryptamine receptor 2A; MTHFR, methylenetetrahydrofolate reductase; qPCR, quantitative polymerase chain reaction; TPMT, thiopurine S-methyltransferase; UGT1A1, UDP glucuronosyltransferase family 1 member A1; UGT2B7, UDP glucuronosyltransferase family 2 member B7.
Abbreviations: ABCC1, ATP-binding cassette subfamily C member 1; ABCC2, ATP-binding cassette subfamily C member 2; ABCC3, ATP-binding cassette subfamily C member 3; ABCG2, ATP-binding cassette subfamily G member 2; ADRA2A, adrenoceptor α2A; ALDH1A1, aldehyde dehydrogenase 1 family; Apo E, apolipoprotein E; COMT, catechol-O-methyltransferase; CYP1A2, cytochrome P450 1A2; CYP2C11, cytochrome P450 2C11; CYP2C22, cytochrome P450 2C22; CYP3A1, cytochrome P450 3A1; CYP3A4, cytochrome P450 3A4; CYP3A5, cytochrome P450 3A5; CYP2C19, cytochrome P450 2C19; DPYD, dihydropyrimidine dehydrogenase; HCC, hepatocellular carcinoma; HTR2A, 5-hydroxytryptamine receptor 2A; MTHFR, methylenetetrahydrofolate reductase; qPCR, quantitative polymerase chain reaction; TPMT, thiopurine S-methyltransferase; UGT1A1, UDP glucuronosyltransferase family 1 member A1; UGT2B7, UDP glucuronosyltransferase family 2 member B7.
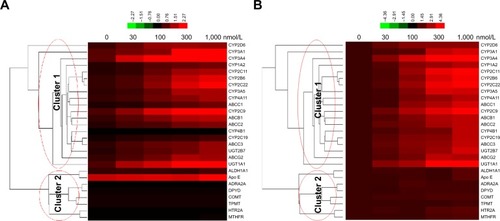
Figure 2 Triclosan did not have toxicity on MHCC97-H cells.
Notes: MHCC97-H cells were treated with solvent control, 30, 100, 300 nmol/L, or 1 μmol/L triclosan for 48 hours before cells being analyzed by MTT experiments. Results are shown as relative cell number (mean ± SD). *P<0.05 100 nmol/L group, 300 nmol/L group, or 1 μmol/L group versus solvent control group.
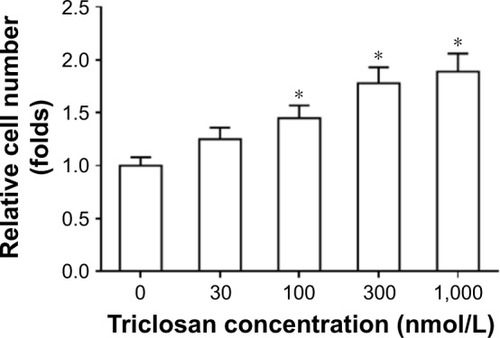
Figure 3 Triclosan promotes the metabolisms or clearances of sorafenib.
Notes: (A) MHCC97-H cells, pretreated with 1 μmol/L sorafenib for 12 hours, were treated with solvent control or 300 nmol/L triclosan. Cells were harvested at indicated time points. (B) MHCC97-H cells were used to form subcutaneous tumor. Sorafenib solution (Sor-Sol) was injected into tumor tissues, and mice were then treated with solvent or 500 μg/kg triclosan. Tumor tissues were harvested at indicated time points. The cell samples or tumor tissue samples were analyzed by LC-MS/MS to value the sustaining of sorafenib concentration. The sustaining curve is shown as mean ± SD. *P<0.05 solvent control group vs triclosan group.
Abbreviation: LC-MS/MS, liquid chromatography/mass spectrometry-mass spectrometry.
Abbreviation: LC-MS/MS, liquid chromatography/mass spectrometry-mass spectrometry.
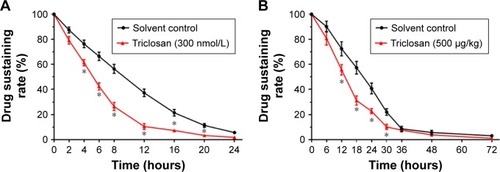
Figure 4 Triclosan decreased the antitumor effect of sorafenib on in vitro MHCC97-H cell proliferation.
Notes: MHCC97-H cells were treated with sorafenib with solvent control, or sorafenib with triclosan. Cells were treated with indicated concentration of drugs (A) or indicated time length (B). Then, cells were harvested for MTT experiments. The dose–effect curve, or time–effect curve, is shown as mean ± SD. *P<0.05 solvent control group versus triclosan group.
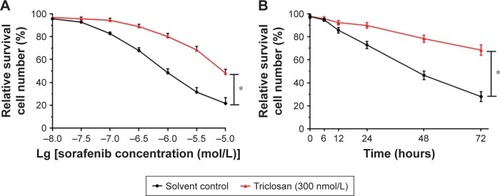
Figure 5 Triclosan decreased the antitumor effect of sorafenib on in vitro patient-derived cells’ proliferation.
Notes: Five lines of patient-derived HCC cells were treated with sorafenib with solvent control, or sorafenib with triclosan. Cells were treated with indicated concentration of drugs or indicated time length. Then, cells were harvested for MTT experiments, and the IC50 values of sorafenib on cells were calculated. *P<0.05 solvent control group versus triclosan group.
Abbreviation: HCC, hepatocellular carcinoma.
Abbreviation: HCC, hepatocellular carcinoma.
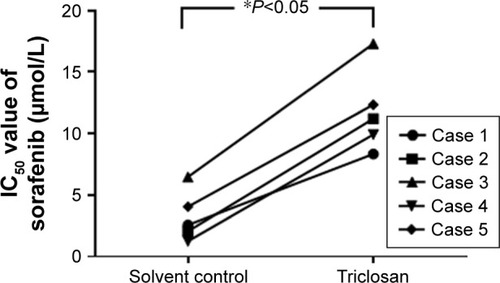
Figure 6 Triclosan decreased the antitumor effect of sorafenib on MHCC97-H cell subcutaneous model.
Notes: MHCC97-H cells were injected into nude mice to form subcutaneous tumors. Mice were divided into four treatment groups with indicated doses: 1) solvent control, 2) sorafenib, 3) triclosan, and 4) sorafenib + triclosan. Results are shown as (A) photographs, (B) tumor volumes, and (C) tumor weights. *P<0.05 solvent control group versus triclosan group; solvent control group versus sorafenib group.
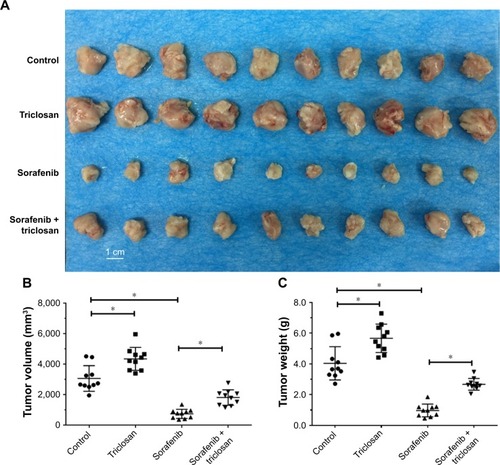
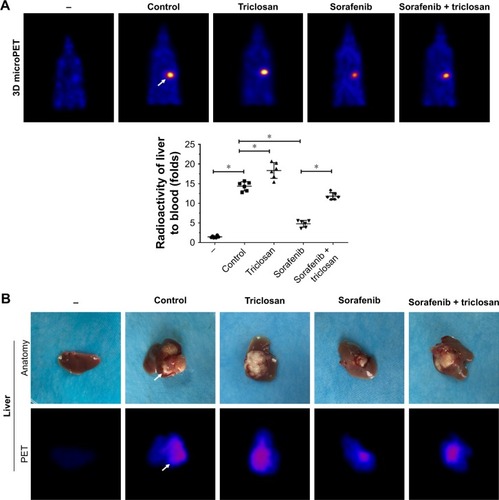
Figure 7 Triclosan decreased the antitumor effect of sorafenib on MHCC97-H cell intrahepatic model.
Notes: MHCC97-H cells were injected into nude mice’s liver lope to form intrahepatic tumors. Mice were divided into four groups: 1) solvent control, 2) sorafenib, 3) triclosan, and 4) sorafenib + triclosan. The tumor nodules formed by MHCC97-H cells in mice’s liver were examined by PET/CT scanning. Results are shown as (A) PET/CT results from animals or radioactivation of liver to blood and (B) tumor organs or PET/CT results from liver organs. *P<0.05 solvent control group versus triclosan group; solvent control group versus sorafenib group.
Abbreviation: PET/CT, positron emission tomography/computed tomography.
Abbreviation: PET/CT, positron emission tomography/computed tomography.