
Figures & data
Table 1 Characteristics of the microarray datasets from GEO database
Figure 1 Venn diagram of DEM/DEG selection in different datasets.
Notes: (A) DEMs; (B) upregulated DEGs; (C) downregulated DEGs.
Abbreviations: DEGs, differentially expressed genes; DEM, differentially expressed miRNA; miRNAs, microRNAs.
Abbreviations: DEGs, differentially expressed genes; DEM, differentially expressed miRNA; miRNAs, microRNAs.
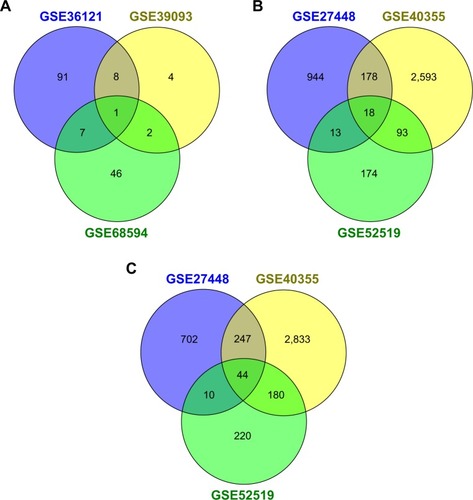
Table 2 Results of significant GO biological processes and the KEGG pathway analysis
Figure 2 PPI network of DEGs.
Notes: (A) Upregulated DEGs; (B) downregulated DEGs.
Abbreviations: DEGs, differentially expressed genes; PPI, protein–protein interaction.
Abbreviations: DEGs, differentially expressed genes; PPI, protein–protein interaction.
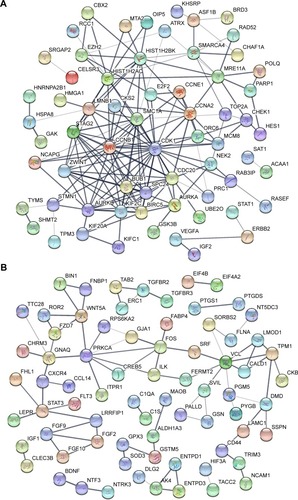
Table 3 The top 5% hub genes in the PPI networks
Figure 3 The miRNA–mRNA regulatory network.
Note: Round nodes, miRNA; square nodes, mRNA; green line, from Targetscan database; blue line, from miRanda prediction.
Abbreviation: miRNA, microRNA.
Abbreviation: miRNA, microRNA.
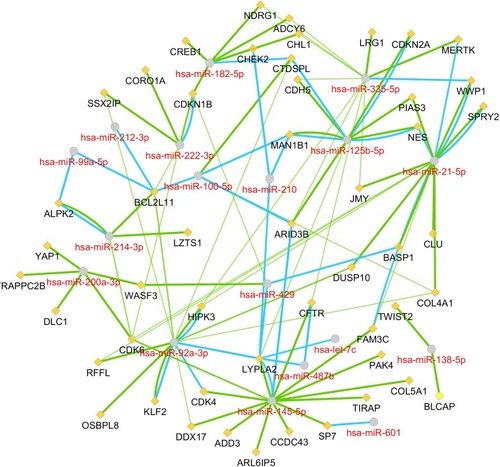
Table 4 Results of the significant DEM expression validation and the relationship with bladder cancer clinical stages in TCGA dataset
Figure 4 The Kaplan–Meier plots of patients from TCGA dataset.
Notes: Survival plots of the bladder cancer patients with high and low expression of miR-145-3p (A), miR-126-5p (B), miR-99a-5p (C), miR-100-5p (D), miR-214-5p (E), miR-487b-3p (F), miR-200a-3p (G) and miR-138-5p (H).
Abbreviation: TCGA, The Cancer Genome Atlas.
Abbreviation: TCGA, The Cancer Genome Atlas.
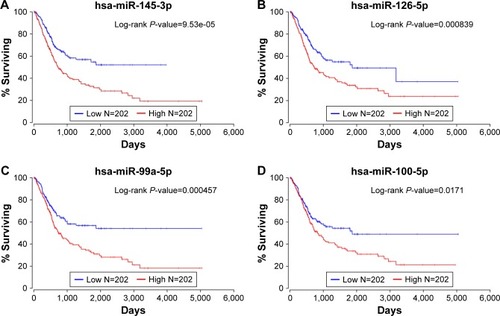
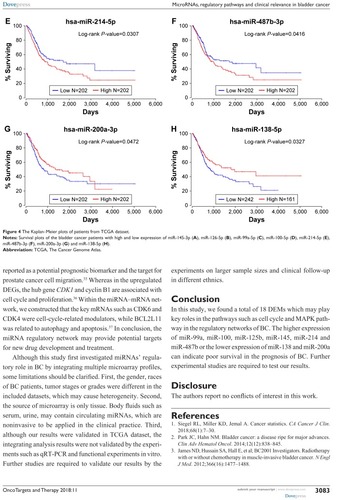
Figure S1 Venn diagram of DEMs (A: Ta–T1 vs T2–T4; B: G3 vs G1) in different datasets.
Notes: (A) GSE36121: hsa-miR-135b, hsa-miR-508, hsa-miR-7, hsa-miR-21, hsa-miR-615, hsa-miR-124, hsa-miR-106b, hsa-miR-98, hsa-miR-132, hsa-miR-30e, hsa-miR-130a, hsa-miR-193a, hsa-miR-582, hsa-miR-151, hsa-let-7c. GSE39093: hsa-mir-1308, hsa-mir-192, hsa-mir-574, hsa-mir-720, hsa-mir-92b. GSE68594: hsa-let-7b, hsa-let-7c, hsa-let-7d, hsa-let-7f, hsa-let-7i, hsa-mir-155, hsa-mir-196, hsa-mir-429, hsa-mir-579. (B) GSE36121: hsa-miR-1224-5p, hsa-miR-1225-5p, hsa-miR-1228, hsa-miR-125a-3p, hsa-miR-134, hsa-miR-135a, hsa-miR-135b, hsa-miR-136, hsa-miR-146a, hsa-miR-150, hsa-miR-188-5p, hsa-miR-192, hsa-miR-193a-3p, hsa-miR-194, hsa-miR-197, hsa-miR-21, hsa-miR-224, hsa-miR-31, hsa-miR-345, hsa-miR-362-5p, hsa-miR-363, hsa-miR-371-5p, hsa-miR-423-5p, hsa-miR-508-5p, hsa-miR-518c, hsa-miR-532-5p, hsa-miR-574-5p, hsa-miR-575, hsa-miR-582-5p, hsa-miR-598, hsa-miR-601, hsa-miR-622, hsa-miR-629, hsa-miR-663, hsa-miR-671-5p, hsa-miR-7, hsa-miR-801, hsa-miR-940. GSE68594: hsa-let-7d, hsa-let-7f, hsa-let-7i, hsa-mir-122a, hsa-mir-184, hsa-mir-196a1, hsa-mir-196a2, hsa-mir-203, hsa-mir-206, hsa-mir-223, hsa-mir-34a, hsa-mir-595, hsa-mir-601, hsa-mir-611-P.
Abbreviations: DEMs, differentially expressed miRNAs; miRNAs, microRNAs.
Abbreviations: DEMs, differentially expressed miRNAs; miRNAs, microRNAs.
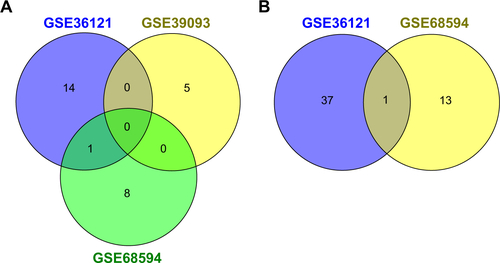
Table S1 Detailed information of patients in each included GEO datasets