
Figures & data
Table 1 Statistics of the three microarray databases derived from the GEO database
Figure 1 Venn diagram of DEGs common to all three GEO datasets.
Notes: (A) Downregulated genes. (B) Upregulated genes.
Abbreviations: DEG, differentially expressed gene; GEO, Gene Expression Omnibus.
Abbreviations: DEG, differentially expressed gene; GEO, Gene Expression Omnibus.
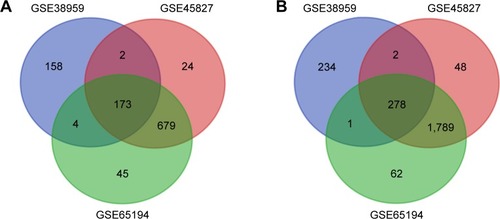
Table 2 Significantly enriched GO terms and KEGG pathways of DEGs
Table 3 Top ten hub genes with higher degree of connectivity
Figure 2 Protein–protein interaction network constructed with the differentially expressed genes.
Note: Red nodes represent upregulated genes, and blue nodes represent downregulated genes.
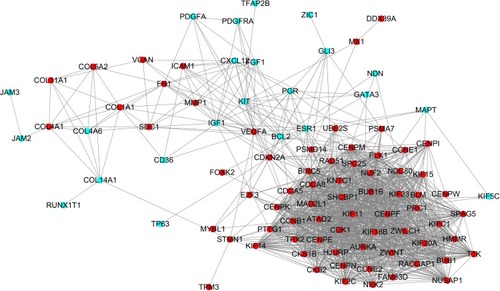
Figure 3 Kaplan–Meier overall survival analyses for the top ten hub genes expressed in breast cancer patients.
Note: See for gene description.
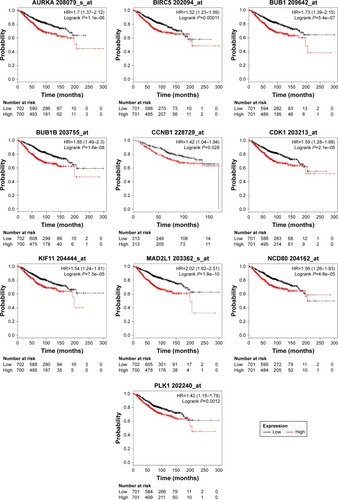
Figure 4 Kaplan–Meier relapse-free survival analyses for CCNB1 expression in TNBC patients.
Abbreviations:
CCNB1 cyclin B1; TNBC, triple-negative breast cancer.
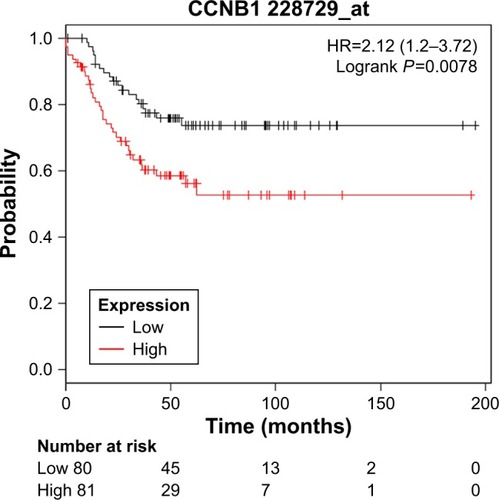
Table S1 The desired probes of hub genes in the Kaplan–Meier plotter database