Figures & data
Table 1 Characteristics of studies included in the meta-analysis
Figure 1 The flow diagram indicated the process of study selection.
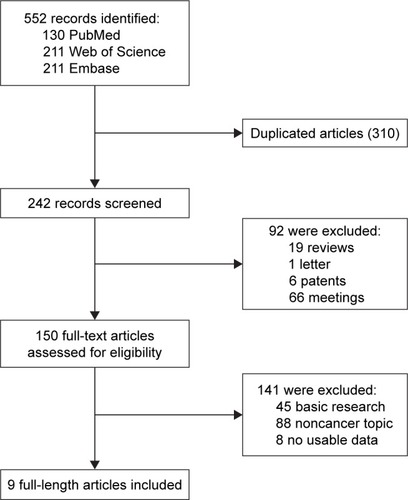
Table 2 Subgroup analyses of pooled HRs for OS in cancer patients with abnormal expression level of DEPTOR
Figure 2 Meta-analysis of the pooled HRs of OS for cancer patients.
Note: Weights are from random effects analysis.
Abbreviation: OS, overall survival.
Abbreviation: OS, overall survival.
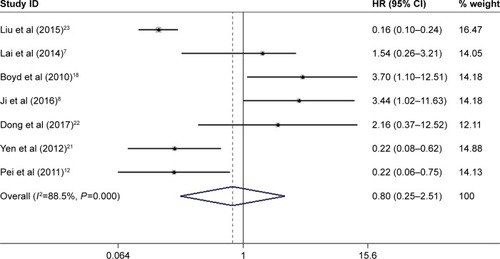
Figure 3 Results of subgroup analysis of pooled HRs of OS for cancer patients.
Notes: (A) Subgroup analysis stratified by sample size. (B) Subgroup analysis stratified by type of cancer. (C) Subgroup analysis stratified by NOS score. (D) Subgroup analysis stratified by evaluation of DEPTOR expression. Weights are from random effects analysis.
Abbreviations: OS, overall survival; NOS, Newcastle–Ottawa Scale.
Abbreviations: OS, overall survival; NOS, Newcastle–Ottawa Scale.
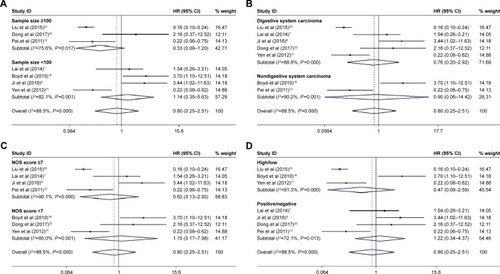
Figure 4 Meta-analysis of the pooled HRs of EFS for cancer patients.
Note: Weights are from random-effects analysis.
Abbreviation: EFS, event-free survival.
Abbreviation: EFS, event-free survival.
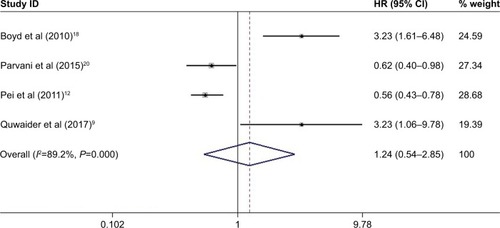
Table 3 Association between DEPTOR and clinicopathological characteristics of cancer patients
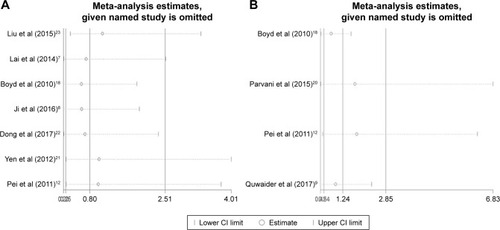
Figure 5 Sensitivity analysis plot of pooled HRs of OS (A) and EFS (B) for cancer patients with abnormally expressed DEPTOR.
Abbreviations: OS, overall survival; EFS, event-free survival.