
Figures & data
Table 1 Characteristics of the studies included for analysis
Figure 1 Flowchart of study selection.
Abbreviations: ASCO, American Society of Clinical Oncology; ESMO, European Society of Medical Oncology.
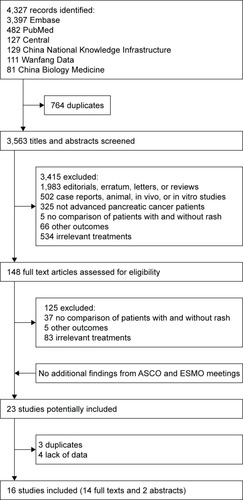
Figure 2 (A) Forest plot of HR for OS: with vs without rash. (B) Forest plot of HR for OS: high-grade rash vs low-grade rash.
Note: Both Wacker et al (2007)Citation28 and Aranda et al (2012)Citation10 had two comparisons, because they reported the comparisons of grade-1 rash with no rash and grade-2 rash with no rash separately, and the comparison of any-grade rash with no rash was not available.
Abbreviation: OS, overall survival.
Abbreviation: OS, overall survival.
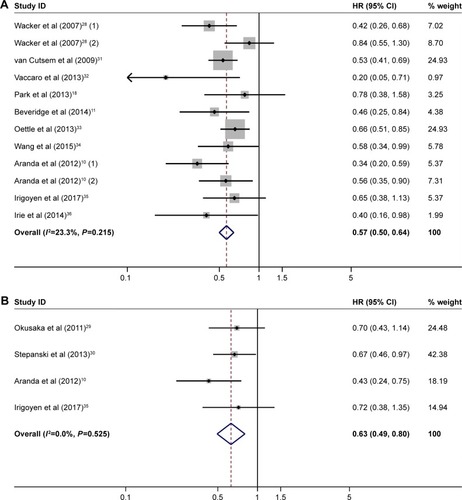
Figure 3 (A) Forest plot of HR for PFS: with vs without rash. (B) Forest plot of HR for PFS: high-grade vs low-grade rash.
Notes: Both Wacker et al (2007)Citation28 and Aranda et al (2012)Citation10 had two comparisons, because they reported the comparisons of grade-1 rash with no rash and grade-2 rash with no rash separately, and the comparison of any-grade rash with no rash was not available. Weights are from random-effects analysis.
Abbreviation: PFS, progression-free survival.
Abbreviation: PFS, progression-free survival.
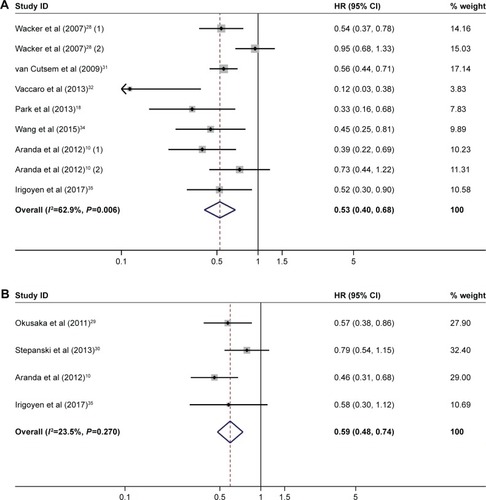
Figure 4 (A) Forest plot of OR for objective response: with vs without rash. (B) Forest plot of OR for objective response: high-grade rash vs low-grade rash.
Note: Data analysis software automatically dropped Cheng et al (2010)Citation37 because of the zero events in both groups.
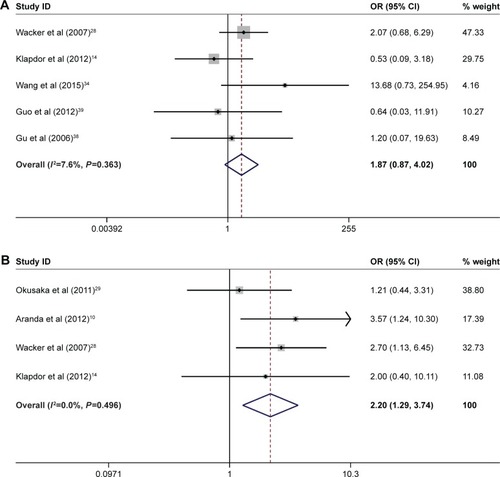
Figure S1 Funnel plot based on the data of (HR for OS with versus without rash).
Abbreviations: OS, overall survival; SE, standard error.
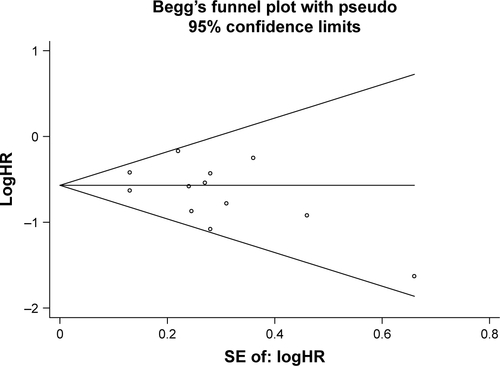
Table S1 Quality assessment of included studies by the Newcastle–Ottawa scale
Table S2 Sensitivity analyses
Table S3 Subgroup analyses