Figures & data
Table 1 The primer sequences for qRT-PCR analyses
Table 2 The enriched GO BP and pathway for overlapping upregulated and downregulated genes, respectively
Figure 1 Four modules extracted from the PPI network.
Note: Red node indicates upregulated genes, and green node represents downregulated genes. Abbreviation: PPI, protein–protein interaction.
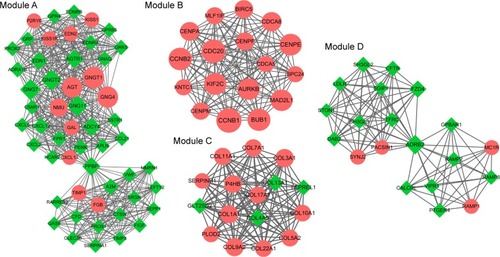
Figure 2 TF–miRNA–target network of the overlapping DEGs.
Notes: Red node indicates upregulated genes, and green node indicates downregulated genes. White triangle represents TF, and white quadrilateral represents miRNA. Among them, the DEG FOXM1 is also a TF.
Abbreviations: DEGs, differentially expressed genes; TF, transcription factor.
Abbreviations: DEGs, differentially expressed genes; TF, transcription factor.
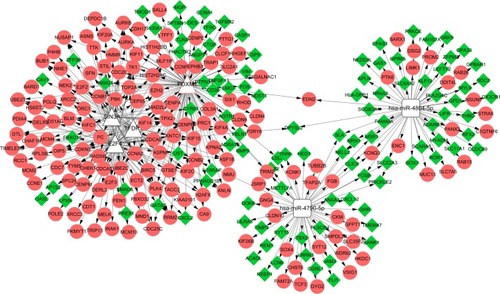
Figure 3 Survival curves.
Notes: (A) Survival curves of NPAS2 expression. (B) Survival curves of GNG7 expression. (C) Survival curves of CHIA expression. (D) Survival curves of SLC2A1 expression.
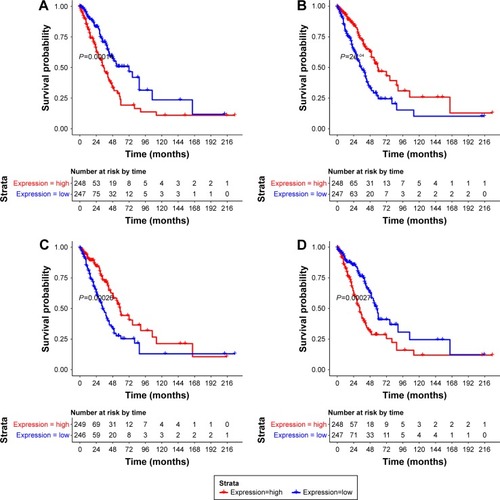
Figure 4 qRT-PCR validation of the expression of NPAS2 (A), GNG7 (B), CHIA (C), and SLC2A1 (D) in the human non-small-cell lung cancer cell line A549 compared with those in the human normal bronchial epithelial cell line BEAS-2B. *P-value<0.05.
Abbreviation: qRT-PCR, quantitative real-time PCR.
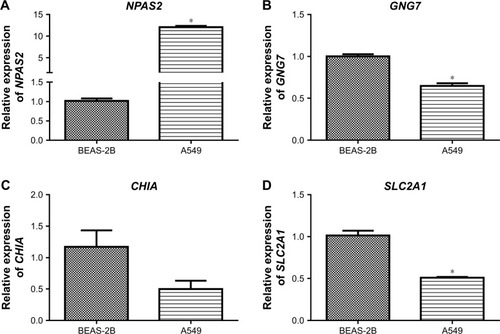
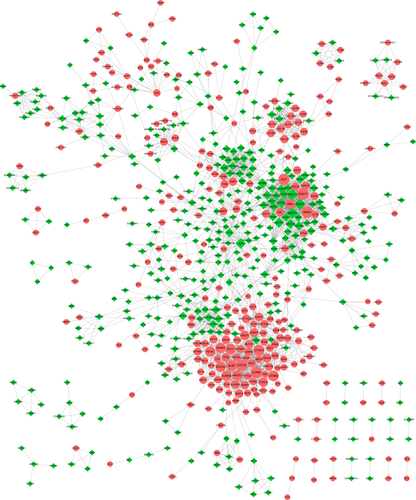
Figure S1 PPI network of the overlapping DEGs.
Abbreviations: DEGs, differentially expressed genes; PI, protein–protein interaction.