Figures & data
Table 1 The differentially expressed cyclins mRNA in GC
Figure 1 Cyclins expression in gastric cancer in Oncomine datasets.
Abbreviations: GC, gastric cancer; std, standard.
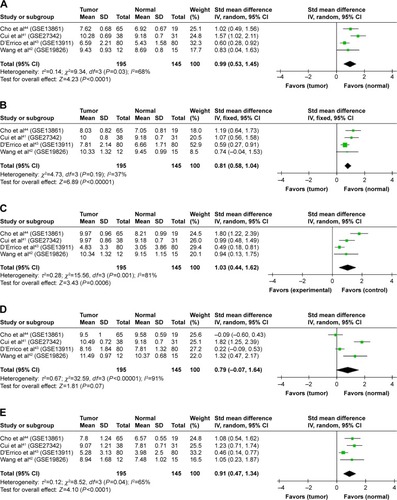
Figure 2 Cyclins expression in GC in TCGA dataset.
Abbreviations: GC, gastric cancer; TCGA, The Cancer Genome Atlas.
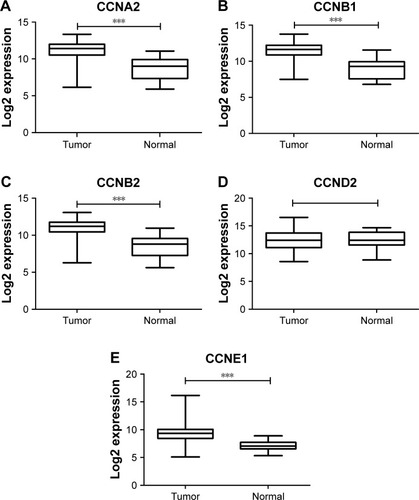
Figure 3 CCNB1 and CCNE1 expressions in GC Lauren subtype.
Abbreviations: GC, gastric cancer; TCGA, The Cancer Genome Atlas.
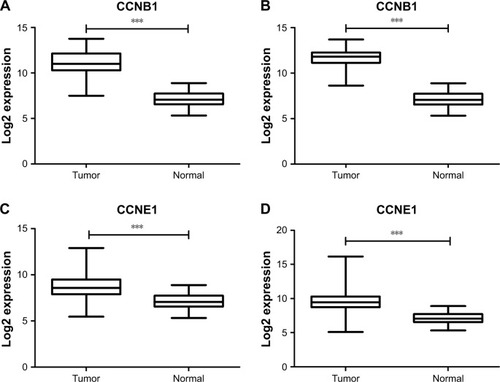
Figure 4 Prognosis roles of differentially expressed cyclins in GC patients in KM Plotter datasets.
Abbreviations: GC, gastric cancer; KM Plotter, Kaplan–Meier Plotter.
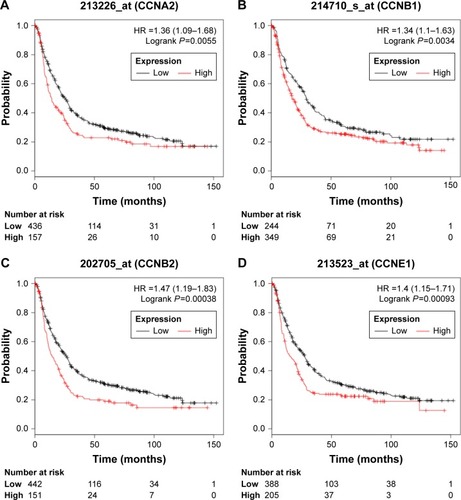
Table 2 The relationship between differentially expressed cyclins and clinicopathological features in previously published studies
Figure 5 Prognosis roles of CCNB1 in different GC patients.
Abbreviations: GC, gastric cancer; KM Plotter, Kaplan–Meier Plotter.
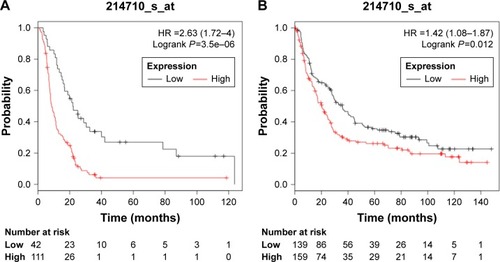
Table 3 Enrichment analysis of cyclins
Figure 6 Protein–protein interaction network of differentially expressed cyclins.
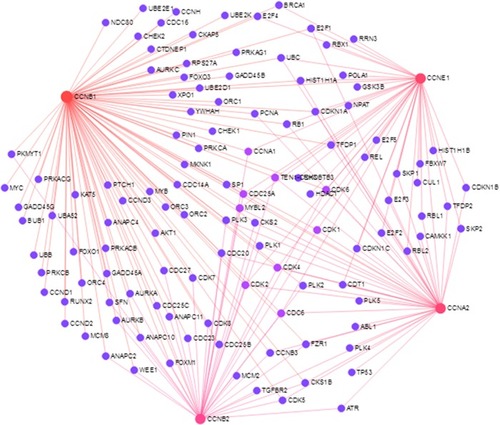
Figure S1 The ROC curves of CCNA2, CCNB1, CCNB2, and CCNE1 were constructed for GC diagnosis.
Abbreviations: AUC, area under curve; GC, gastric cancer; ROC, receiver operating characteristic.
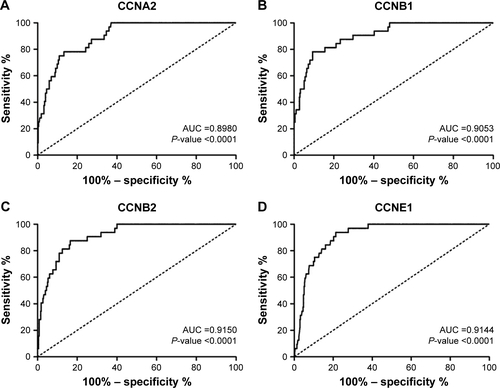
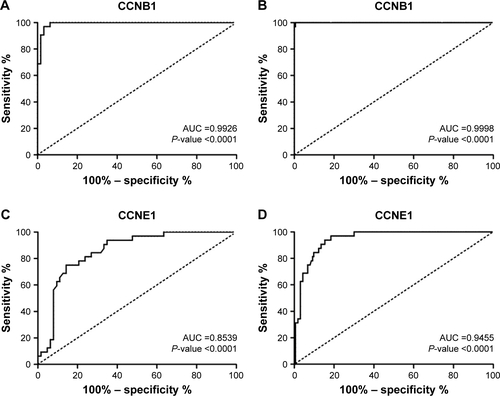
Figure S2 The ROC curves of CCNB1 and CCNE1 for GC Lauren subtype classification.
Abbreviations: AUC, area under curve; GC, gastric cancer; ROC, receiver operating characteristic.