
Figures & data
Figure 1 Clustering of samples and determination of soft-thresholding power.
Abbreviations: OSCC, oral squamous cell carcinoma; WGCNA, weighted gene co-expression network analysis.
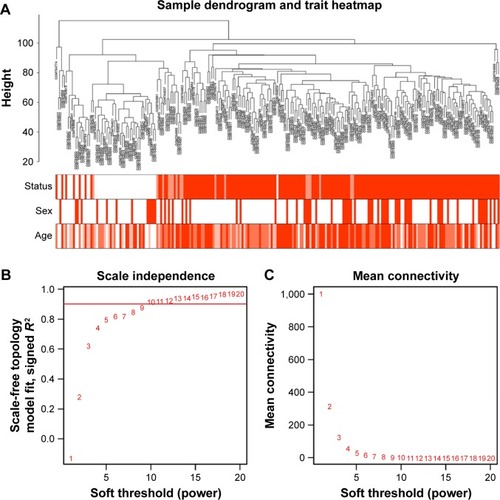
Figure 2 Construction of co-expression modules by WGCNA package in R.
Abbreviation: WGCNA, weighted gene co-expression network analysis.
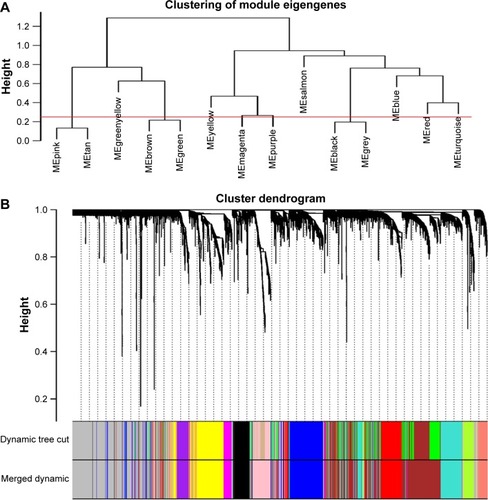
Figure 3 (A) Interaction relationship analysis of co-expression genes. Different colors of horizontal axis and vertical axis represent different modules. The brightness of yellow in the middle represents the degree of connectivity of different modules. There was no significant difference in interactions among different modules, indicating a high-scale independence degree among these modules. (B) Heatmap of the correlation between module eigengenes and the disease status of OSCC. The turquoise module was the most positively correlated with status, and the brown module was the most negatively correlated with status. (C) Hierarchical clustering of module hub genes that summarize the modules yielded in the clustering analysis. (D) Heatmap plot of the adjacencies in the hub gene network.
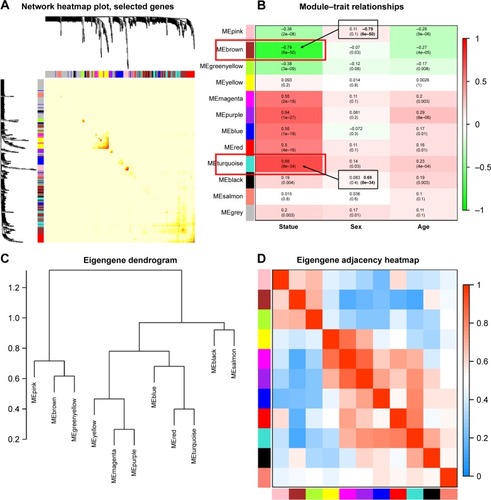
Figure 4 (A) Scatter plot of module eigengenes in the turquoise module. (B) Scatter plot of module eigengenes in the brown module. (C) The top 30 hub genes in the turquoise module. (D) The top 30 hub genes in the brown module. Nodes represent genes, and node size is correlated with connectivity of the gene by degree.
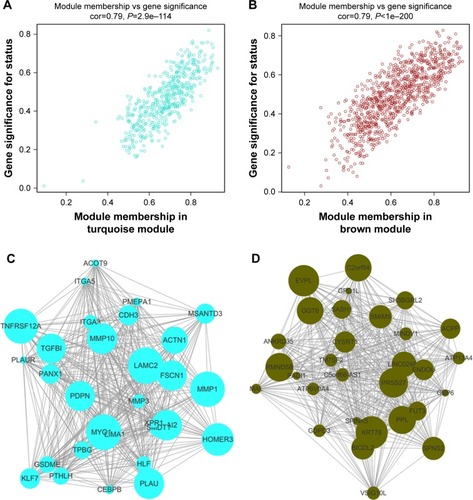
Figure 5 Survival analysis of hub genes.
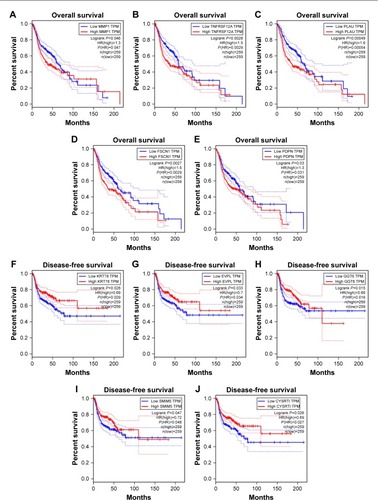
Table 1 GO enrichment analysis of turquoise module and brown module
Table 2 KEGG pathway enrichment analysis of turquoise module and brown module
Figure 6 Validation of hub genes in GSE31056.
Abbreviations: DEGs, differently expressed genes; OSCC, oral squamous cell carcinoma.
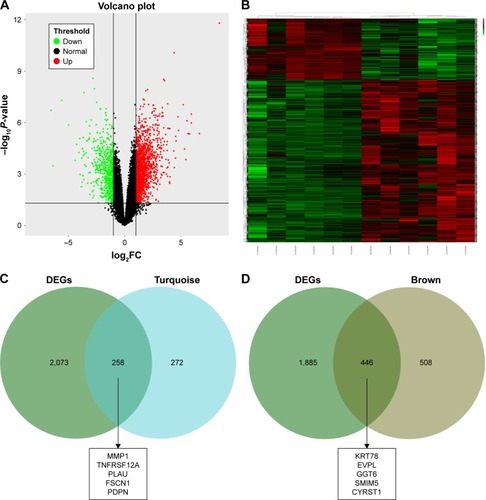
Figure 7 Validation of hub genes in the transcriptional level.
Abbreviations: WGCNA, weighted gene co-expression network analysis; HNSC, head and neck squamous cell carcinoma.
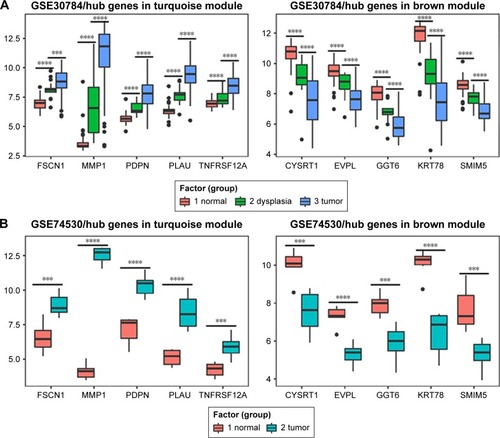
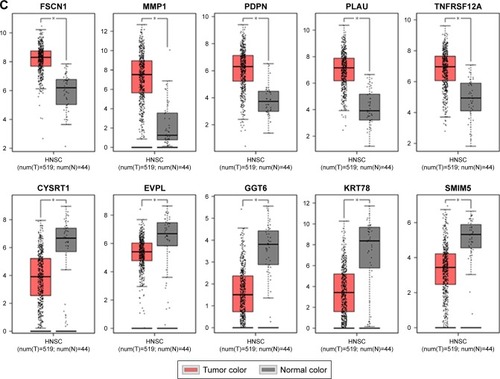
Figure 8 Validation of hub genes in the translational level.
Abbreviations: IHC, immunohistochemistry; OSCC, oral squamous cell carcinoma.
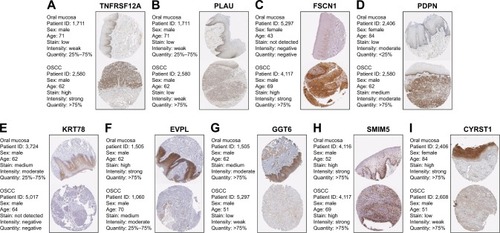
Figure 9 Genetic alterations associated with hub genes in TCGA HNSC.
Abbreviation: HNSC, head and neck squamous cell carcinoma.
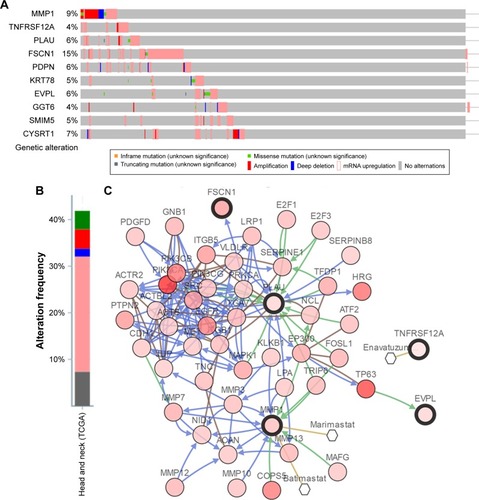
Figure S1 The medianRank and Zsummary statistics of module preservation.
Abbreviation: OSCC, oral squamous cell carcinoma.
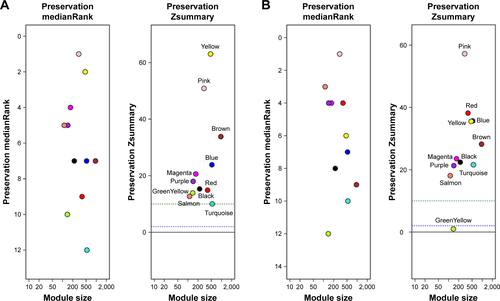
Figure S2 (A) Volcano plot visualizing DEGs in GSE30784 (45 normal samples and 167 OSCC). The vertical lines demark the fold change values. The right vertical line corresponds to more than or equal to twofold up changes, and the left vertical line corresponds to twofold down changes, while the horizontal line marks a –log10 adjusted P-value of 0.01. (B) Heat map hierarchical clustering reveals DEGs in OSCC groups compared with control groups.
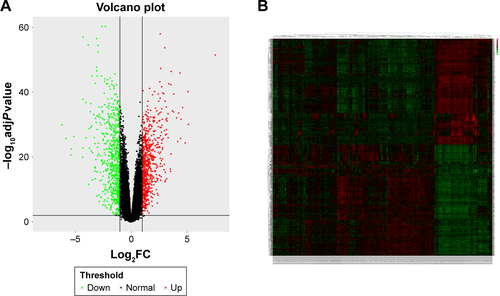
Figure S3 Survival analysis of the 10 hub genes using GSE41613 for validation.
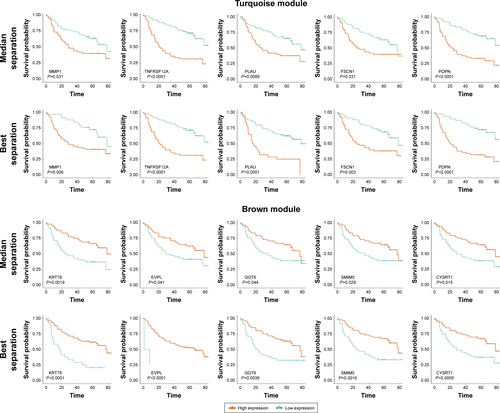
Table S1 GO enrichment analysis of DEGs
Table S2 KEGG pathway enrichment analysis of turquoise module and brown module