Figures & data
Table 1 Antibodies
Figure 1 Clonogenic assays were performed to detect the reproductive capacity of 786-O and A-498 cells after CD treatment.
Abbreviation: CD, 16-hydroxycleroda-3,13-dien-15,16-olide.
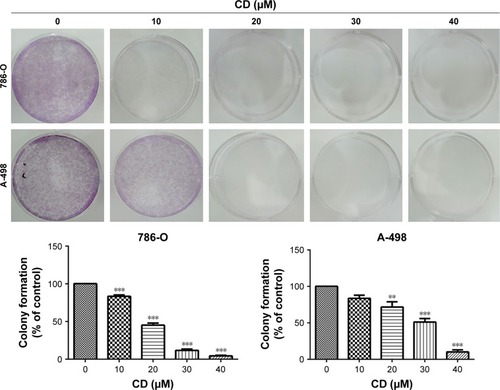
Figure 2 Cells (786-O and A-498) were treated with 0.1% DMSO or CD (10–40 µM) for 24 hours.
Abbreviations: CD, 16-hydroxycleroda-3,13-dien-15,16-olide; DMSO, dimethyl sulfoxide.
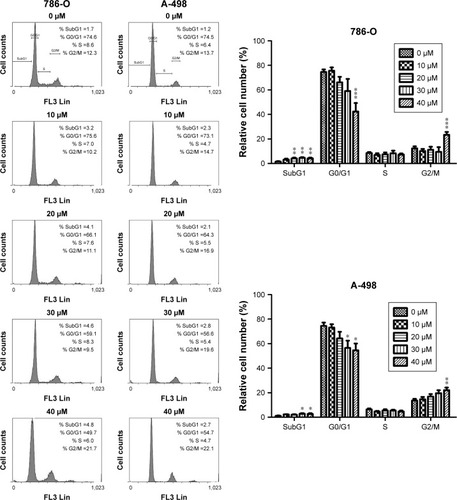
Figure 3 (A) Immunoblots of cyclins, CDKs, p21, and p53 in CD-treated RCC cells. GAPDH was used as the internal control. (B) The bar graphs show densitometric data (mean±SD) from three to five independent experiments.
Abbreviations: CD, 16-hydroxycleroda-3,13-dien-15,16-olide; CDK, cyclin-dependent kinase; RCC, renal cell carcinoma.
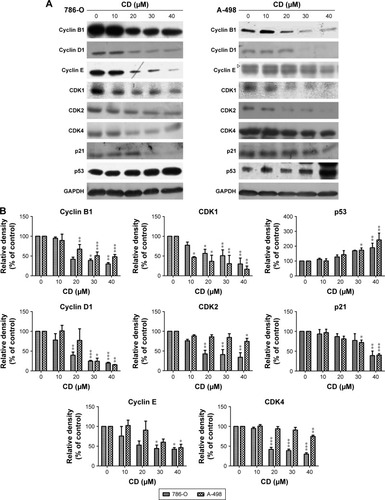
Figure 4 (A) Scratch assay of RCC cells treated with the indicated concentration of CD for 8 and 20 hours. (B) Transwell migration assay of RCC cells treated with 0.1% DMSO, 10 or 20 µM, and 40 µM CD for 24 hours. Scale bar =50 µm. 50× magnification. (C) Matrigel invasion assay of RCC cells treated with 0.1% DMSO or 40 µM CD for 24 hours. Scale bar =50 µm. 100× magnification.
Abbreviations: CD, 16-hydroxycleroda-3,13-dien-15,16-olide; DMSO, dimethyl sulfoxide; RCC, renal cell carcinoma.
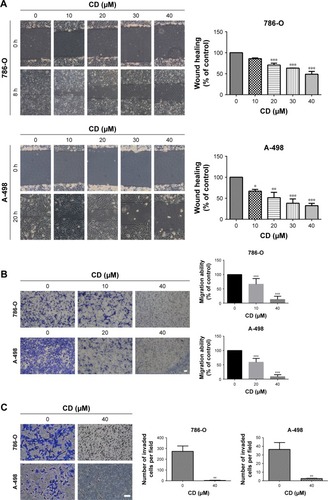
Figure 5 RCC cells were treated with 0.1% DMSO (control) or 40 µM CD for 24 hours.
Abbreviations: CD, 16-hydroxycleroda-3,13-dien-15,16-olide; DMSO, dimethyl sulfoxide; FA, focal adhesion; FITC, fluorescein isothiocyanate; pFAK, phosphorylated focal adhesion kinase; RCC, renal cell carcinoma.
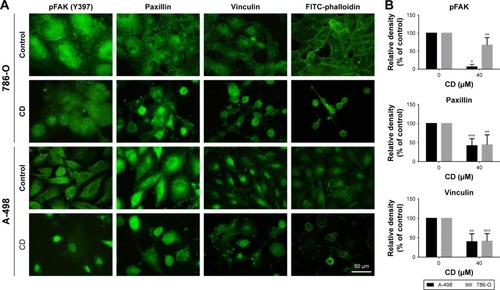
Figure 6 (A) Immunoblots of FAK-related signaling molecules. The figures shown are representative of one experiment. (B) The bar graphs show densitometric data (mean±SD) from three independent experiments.
Abbreviations: CD, 16-hydroxycleroda-3,13-dien-15,16-olide; FAK, focal adhesion kinase; pFAK, phosphorylated focal adhesion kinase.
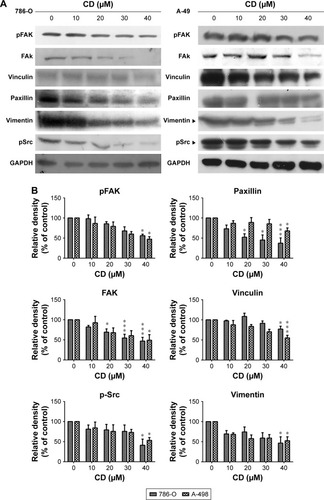
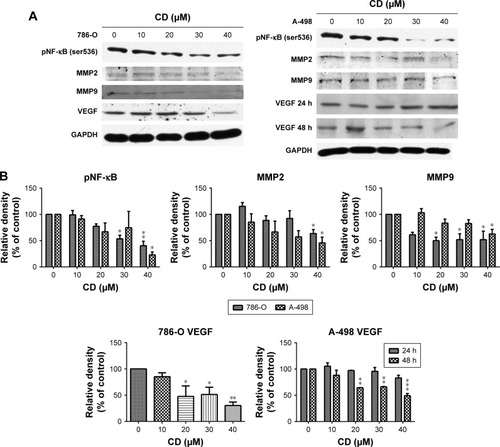
Figure 7 (A) Immunoblots of pNF-κB, MMPs, and VEGF in CD-treated RCC cells. The figures shown are representative of one experiment. (B) The bar graphs show densitometric data (mean±SD) from three independent experiments.
Abbreviations: CD, 16-hydroxycleroda-3,13-dien-15,16-olide; MMP, matrix metalloproteinase; RCC, renal cell carcinoma; VEGF, vascular endothelial growth factor.