
Figures & data
Table 1 Clinical features of patients enrolled in this study
Table 2 Analysis of pain in patients after treatments
Table 3 Analysis of physical status score in patients after treatments
Table 4 Comparison of treatment effect in both groups
Figure 1 CT scan images of typical patients in group A.
Notes: (A1, A2) CT scan of a 62-year-old male patient with adenocarcinoma. (A1) The pre-treatment CT image shows a mass in the left upper lobe (October 14, 2013). (A2) The target lesion completely disappeared after the combination of iodine-125 seed implantation and chemotherapy regimen. The chest pain symptoms were relieved considerably (March 12, 2014). (B1, B2). CT scan of a 60-year-old male patient with adenocarcinoma. (B1) The pre-treatment lung CT image shows a mass near the trachea in the right upper lobe (October 8, 2016). (B2) Six months after treatment, the CT scan indicated a complete response (April 17, 2017). (C1, C2) CT scan of a 67-year-old male patient with squamous cell carcinoma. (C1) The pre-treatment CT image shows an irregular mass in the left lower lobe (June 1, 2016). (C2) The lesion is significantly decreased in size and partially cavitated 6 months after treatment. Difficult breathing was relieved obviously (December 5, 2016). Group A, 50 elderly patients with stage III or IV NSCLC treated with the chemotherapy regimens (paclitaxel/cisplatin) and CT-guided iodine-125 brachytherapy.
Abbreviations: CT, computer tomography; NSCLC, non-small-cell lung cancer.
Abbreviations: CT, computer tomography; NSCLC, non-small-cell lung cancer.
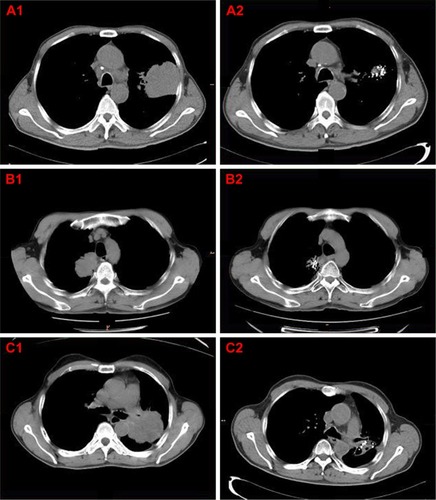
Figure 2 Kaplan–Meier curve of progression-free survival of patients in groups A and B.
Notes: Group A, 50 elderly patients with stage III or IV NSCLC treated with the chemotherapy regimens (paclitaxel/cisplatin) and CT-guided iodine-125 brachytherapy. Group B, 50 patients who received chemotherapy consisting of paclitaxel and cisplatin only.
Abbreviations: CT, computer tomography; cum, cumulative; NSCLC, non-small-cell lung cancer.
Abbreviations: CT, computer tomography; cum, cumulative; NSCLC, non-small-cell lung cancer.
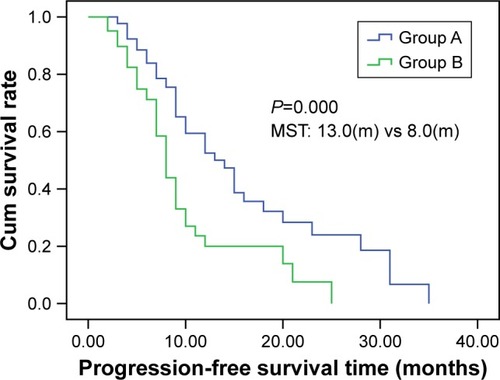
Figure 3 Kaplan–Meier curve of overall survival of patients in groups A and B.
Notes: Group A, 50 elderly patients with stage III or IV NSCLC treated with the chemotherapy regimens (paclitaxel/cisplatin) and CT-guided iodine-125 brachytherapy. Group B, 50 patients who received chemotherapy consisting of paclitaxel and cisplatin only.
Abbreviations: CT, computer tomography; cum, cumulative; NSCLC, non-small-cell lung cancer.
Abbreviations: CT, computer tomography; cum, cumulative; NSCLC, non-small-cell lung cancer.
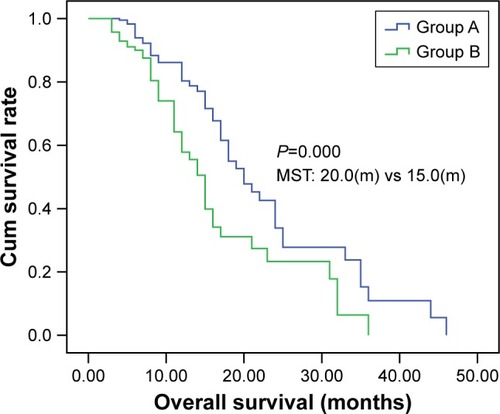
Table 5 Complications after brachytherapy with iodine-125 seed
Table 6 Adverse events observed in both groups upon follow–up