Figures & data
Figure 1 The expression of PRDX1 in ovarian tissues (SP ×200, central SP ×400).
Abbreviations: PRDX1, peroxiredoxin1; SP, scaled pixels.
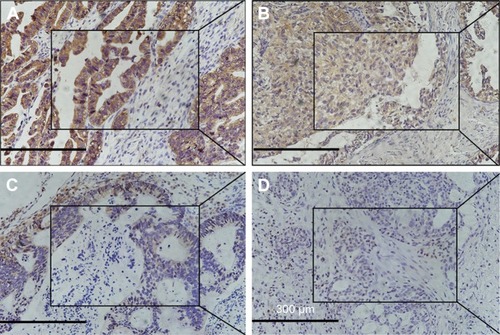
Table 1 Expression of PRDX1 in ovarian tissues
Table 2 Relationship between PRDX1 expression and clinicopathologic parameters for malignant ovarian serous tumors
Figure 2 Relationship between PRDX1 expression and clinicopathologic parameters.
Abbreviation: PRDX1, peroxiredoxin1.
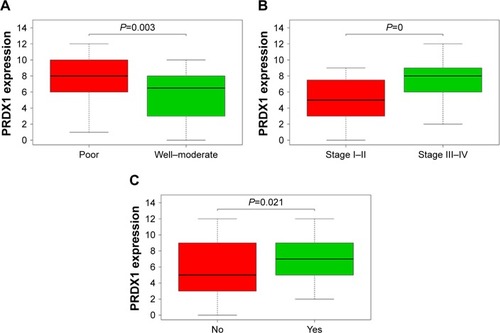
Figure 3 Forest map based on univariate (A) and multivariate (B) Cox regression analyses.
Table 3 Cox regression analysis of overall survival of ovarian epithelial serous tumors
Abbreviations: FIGO, International Federation of Gynecology and Obstetrics; PRDX1, peroxiredoxin1.
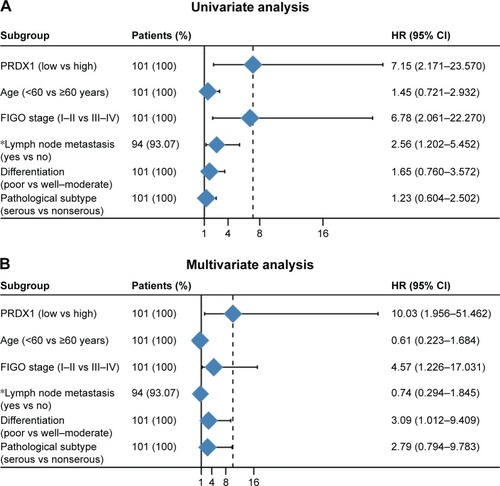
Table 3 Cox regression analysis of overall survival of ovarian epithelial serous tumors
Figure 4 Kaplan–Meier curves for overall survival of patients with epithelial ovarian cancer.
Abbreviations: Cum, cumulative; PRDX1, peroxiredoxin1.
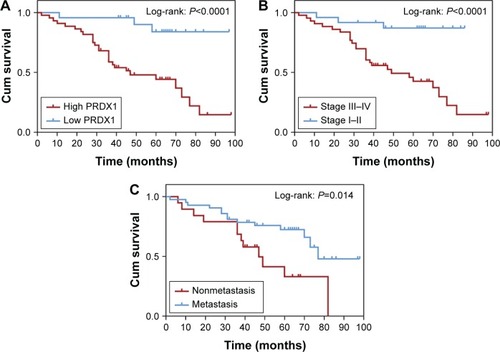
Figure 5 Overall survival and expression differences of PRDX1 in different databases.
Abbreviations: PRDX1, peroxiredoxin1; KM, Kaplan–Meier; TCGA, the Cancer Genome Atlas; TPM, transcripts per million reads.
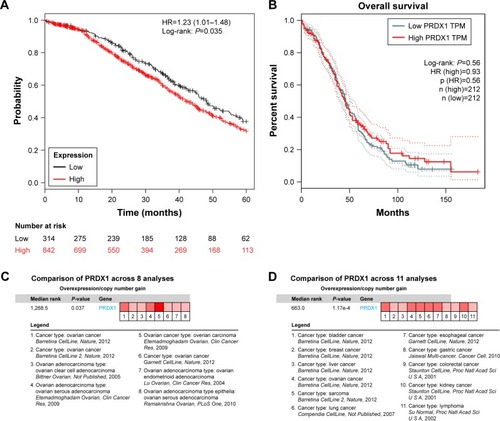
Figure 6 Correlation analysis of PRDX1 expression with copy number variation (A) and methylation data (B).
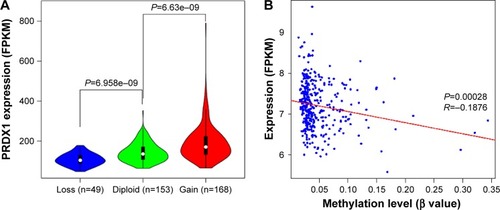
Figure 7 Decreased PRDX1 inhibited proliferation, invasion, and metastasis capacities of ovarian cancer cells in vitro.
Abbreviations: PRDX1, peroxiredoxin1; siRNA, small interfering RNA.
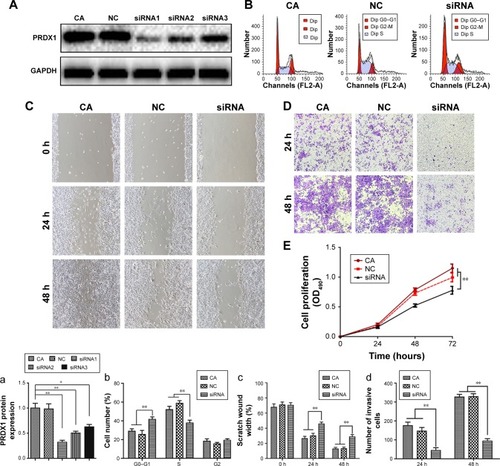
Figure 8 PRDX1 correlated enrichment gene analysis.
Abbreviations: PRDX1, peroxiredoxin1; FDR, false discovery rate; siRNA, small interfering RNA; E-CA, E-cadherin; VIM, vimentin; KEGG, Kyoto Encyclopedia of Genes and Genomes.
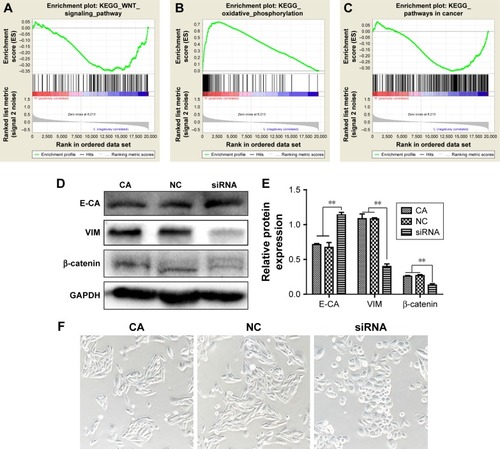
Figure 9 Network of enriched terms and top 30 of GO terms and pathway enrichment analysis.
Abbreviations: PRDX1, peroxiredoxin1; GO, Gene Ontology.
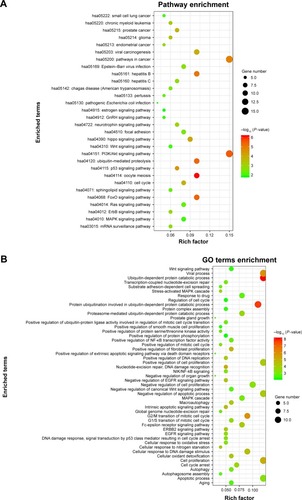
Figure 10 PRDX1 protein–protein interaction network.
Abbreviations: PRDX1, peroxiredoxin1; MCODE, Molecular Complex Detection.
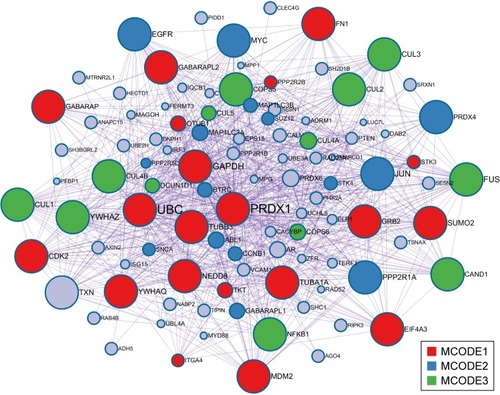
Figure 11 The MCODE module of PPI and biological function and pathways analysis.
Abbreviations: MCODE, Molecular Complex Detection; GO, Gene Ontology; PPI, protein–protein interaction.
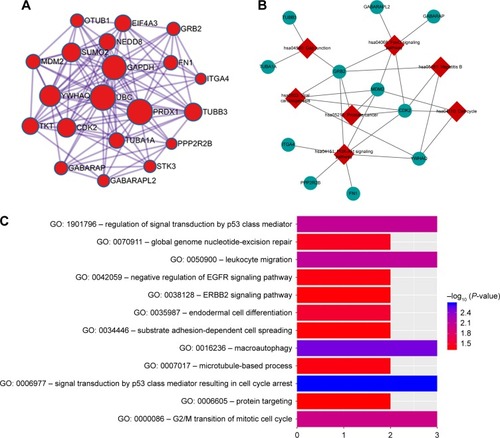
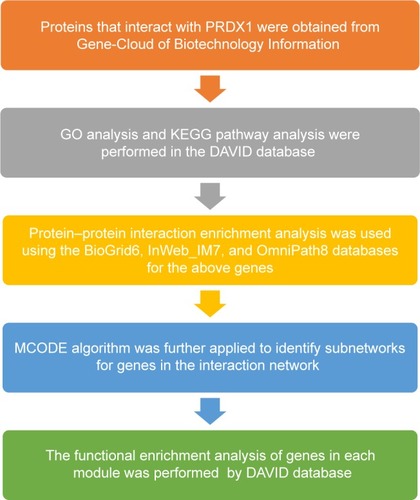
Figure 12 Flowchart of the bioinformatics approach.
Abbreviations: PRDX1, peroxiredoxin1; MCODE, Molecular Complex Detection; GO, Gene Ontology; KEGG, Kyoto Encyclopedia of Genes and Genomes.